
The Automotive Answer Engine
Every car has an answer. We hold the evidence.
Ask about a VIN, price, or market. OAV returns an independent, snapshot-dated answer and the market evidence behind it — a verdict where the evidence supports one, and the evidence itself where it doesn't.
Found a car anywhere? Paste the VIN — OAV resolves it against the supported comparable range, drawn from millions of dealer-advertised listings. Dealers can't pay to change a verdict.
OAV.io is an independent automotive market-evidence platform. It evaluates asking prices against comparable listings and publishes a Price-to-Market verdict when the evidence supports one. Days-on-lot and sell-through from similar vehicles are separate demand evidence, never inputs to the Price-to-Market verdict.
Market snapshot · November 9, 2026
7.3M+
Vehicles tracked nationwide
6M+ searchable on oav.io
60,000+
US dealerships
Daily
Data pipeline
Comparable
Market-evidence analysis
New and used·Listings processed daily
Or explore the market
97 listings found

Image from the dealer's site. OAV does not own, control, or store dealer images.
2003 Ford Ranger XL
Fenton, MO
Fenton, MO

Image from the dealer's site. OAV does not own, control, or store dealer images.
2015 Ford Escape Titanium
Fenton, MO
Comparison: 3 similar vehicles
Fenton, MO

Image from the dealer's site. OAV does not own, control, or store dealer images.
2013 Ford Escape S
Fenton, MO
Fenton, MO

Image from the dealer's site. OAV does not own, control, or store dealer images.
2010 Ford Escape XLT
Fenton, MO
Comparison: 7 similar vehicles
Fenton, MO

Image from the dealer's site. OAV does not own, control, or store dealer images.
2002 Ford F-150 XL
Fenton, MO
Fenton, MO

Image from the dealer's site. OAV does not own, control, or store dealer images.
2016 Ford Escape SE
Fenton, MO
Comparison: 9 similar vehicles
Fenton, MO

Image from the dealer's site. OAV does not own, control, or store dealer images.
2009 Ford Edge SE
Fenton, MO
Fenton, MO

Image from the dealer's site. OAV does not own, control, or store dealer images.
2017 Ford Focus SE
Fenton, MO
Comparison: 14 similar vehicles
Fenton, MO

Image from the dealer's site. OAV does not own, control, or store dealer images.
2010 Ford F-150 XLT
Fenton, MO
Comparison: 26 similar vehicles
Fenton, MO

Image from the dealer's site. OAV does not own, control, or store dealer images.
2011 Ford Flex SEL
Fenton, MO
Fenton, MO

Image from the dealer's site. OAV does not own, control, or store dealer images.
2014 Ford Fusion SE
Fenton, MO
Comparison: 13 similar vehicles
Fenton, MO

Image from the dealer's site. OAV does not own, control, or store dealer images.
2015 Ford Fusion SE
Fenton, MO
Comparison: 10 similar vehicles
Fenton, MO

Image from the dealer's site. OAV does not own, control, or store dealer images.
2013 Ford E-Series Econoline Van Commercial
Fenton, MO
Comparison: 4 similar vehicles
Fenton, MO

Image from the dealer's site. OAV does not own, control, or store dealer images.
2015 Ford Escape Titanium
Fenton, MO
Comparison: 3 similar vehicles
Fenton, MO

Image from the dealer's site. OAV does not own, control, or store dealer images.
2016 Ford Escape Titanium
Fenton, MO
Comparison: 4 similar vehicles
Fenton, MO

Image from the dealer's site. OAV does not own, control, or store dealer images.
2017 Ford Escape SE
Fenton, MO
Comparison: 31 similar vehicles
Fenton, MO

Image from the dealer's site. OAV does not own, control, or store dealer images.
2016 Ford Edge SE
Fenton, MO
Comparison: 13 similar vehicles
Fenton, MO

Image from the dealer's site. OAV does not own, control, or store dealer images.
2012 Ford F-150 XLT
Fenton, MO
Comparison: 17 similar vehicles
Fenton, MO

Image from the dealer's site. OAV does not own, control, or store dealer images.
2017 Ford Escape SE
Fenton, MO
Market: $6,000 – $13,990
Comparison: 31 similar vehicles
Fairly priced — in line with the typical market range for similar vehicles · 85 days listed (based on current market benchmarks)
Fenton, MO

Image from the dealer's site. OAV does not own, control, or store dealer images.
2011 Ford F-250 Super Duty XL
Fenton, MO
Comparison: 6 similar vehicles
Fenton, MO

Image from the dealer's site. OAV does not own, control, or store dealer images.
2019 Ford Fiesta SE
Fenton, MO
Comparison: 3 similar vehicles
Fenton, MO

Image from the dealer's site. OAV does not own, control, or store dealer images.
2014 Ford F-150 XLT
Fenton, MO
Comparison: 9 similar vehicles
Fenton, MO

Image from the dealer's site. OAV does not own, control, or store dealer images.
2020 Ford Escape SE
Fenton, MO
Comparison: 31 similar vehicles
Fenton, MO

Image from the dealer's site. OAV does not own, control, or store dealer images.
2018 Ford Escape Titanium
Fenton, MO
Comparison: 4 similar vehicles
Fenton, MO

Image from the dealer's site. OAV does not own, control, or store dealer images.
2017 Ford Escape Titanium
Fenton, MO
Market: $6,995 – $15,998
Comparison: 26 similar vehicles
Fairly priced — in line with the typical market range for similar vehicles · 76 days listed (based on current market benchmarks)
Fenton, MO

Image from the dealer's site. OAV does not own, control, or store dealer images.
2015 Ford Mustang EcoBoost
Fenton, MO
Comparison: 3 similar vehicles
Fenton, MO

Image from the dealer's site. OAV does not own, control, or store dealer images.
2012 Ford F-150 FX4
Fenton, MO
Comparison: 5 similar vehicles
Fenton, MO

Image from the dealer's site. OAV does not own, control, or store dealer images.
2012 Ford F-250 Super Duty XLT
Fenton, MO
Market: $11,300 – $29,344
Comparison: 10 similar vehicles
Fairly priced — in line with the typical market range for similar vehicles · 39 days listed (based on current market benchmarks)
Fenton, MO

Image from the dealer's site. OAV does not own, control, or store dealer images.
2019 Ford Ecosport Titanium
Fenton, MO
Comparison: 3 similar vehicles
Fenton, MO

Image from the dealer's site. OAV does not own, control, or store dealer images.
2018 Ford F-150 XL
Fenton, MO
Comparison: 18 similar vehicles
Fenton, MO

Image from the dealer's site. OAV does not own, control, or store dealer images.
2015 Ford F-150 XLT
Fenton, MO
Comparison: 16 similar vehicles
Fenton, MO

Image from the dealer's site. OAV does not own, control, or store dealer images.
2015 Ford F-150 King Ranch
Fenton, MO
Comparison: 10 similar vehicles
Fenton, MO

Image from the dealer's site. OAV does not own, control, or store dealer images.
2015 Ford Expedition Platinum
Fenton, MO
Fenton, MO

Image from the dealer's site. OAV does not own, control, or store dealer images.
2020 Ford Escape SEL
Fenton, MO
Market: $11,617 – $15,407
Comparison: 16 similar vehicles
Fairly priced — in line with the typical market range for similar vehicles · 26 days listed (based on current market benchmarks)
Fenton, MO

Image from the dealer's site. OAV does not own, control, or store dealer images.
2019 Ford Edge Titanium
Fenton, MO
Market: $9,995 – $18,995
Comparison: 21 similar vehicles
Fairly priced — in line with the typical market range for similar vehicles · 74 days listed (based on current market benchmarks)
Fenton, MO

Image from the dealer's site. OAV does not own, control, or store dealer images.
2016 Ford F-150 XLT
Fenton, MO
Comparison: 43 similar vehicles
Fenton, MO

Image from the dealer's site. OAV does not own, control, or store dealer images.
2018 Ford Edge SEL
Fenton, MO
Market: $11,900 – $16,078
Comparison: 17 similar vehicles
Fairly priced — in line with the typical market range for similar vehicles · 21 days listed (based on current market benchmarks)
Fenton, MO

Image from the dealer's site. OAV does not own, control, or store dealer images.
2017 Ford F-150 XL
Fenton, MO
Market: $6,999 – $24,500
Comparison: 20 similar vehicles
Fairly priced — in line with the typical market range for similar vehicles · 8 days listed (based on current market benchmarks)
Fenton, MO

Image from the dealer's site. OAV does not own, control, or store dealer images.
2020 Ford Ecosport SE
Fenton, MO
Fenton, MO
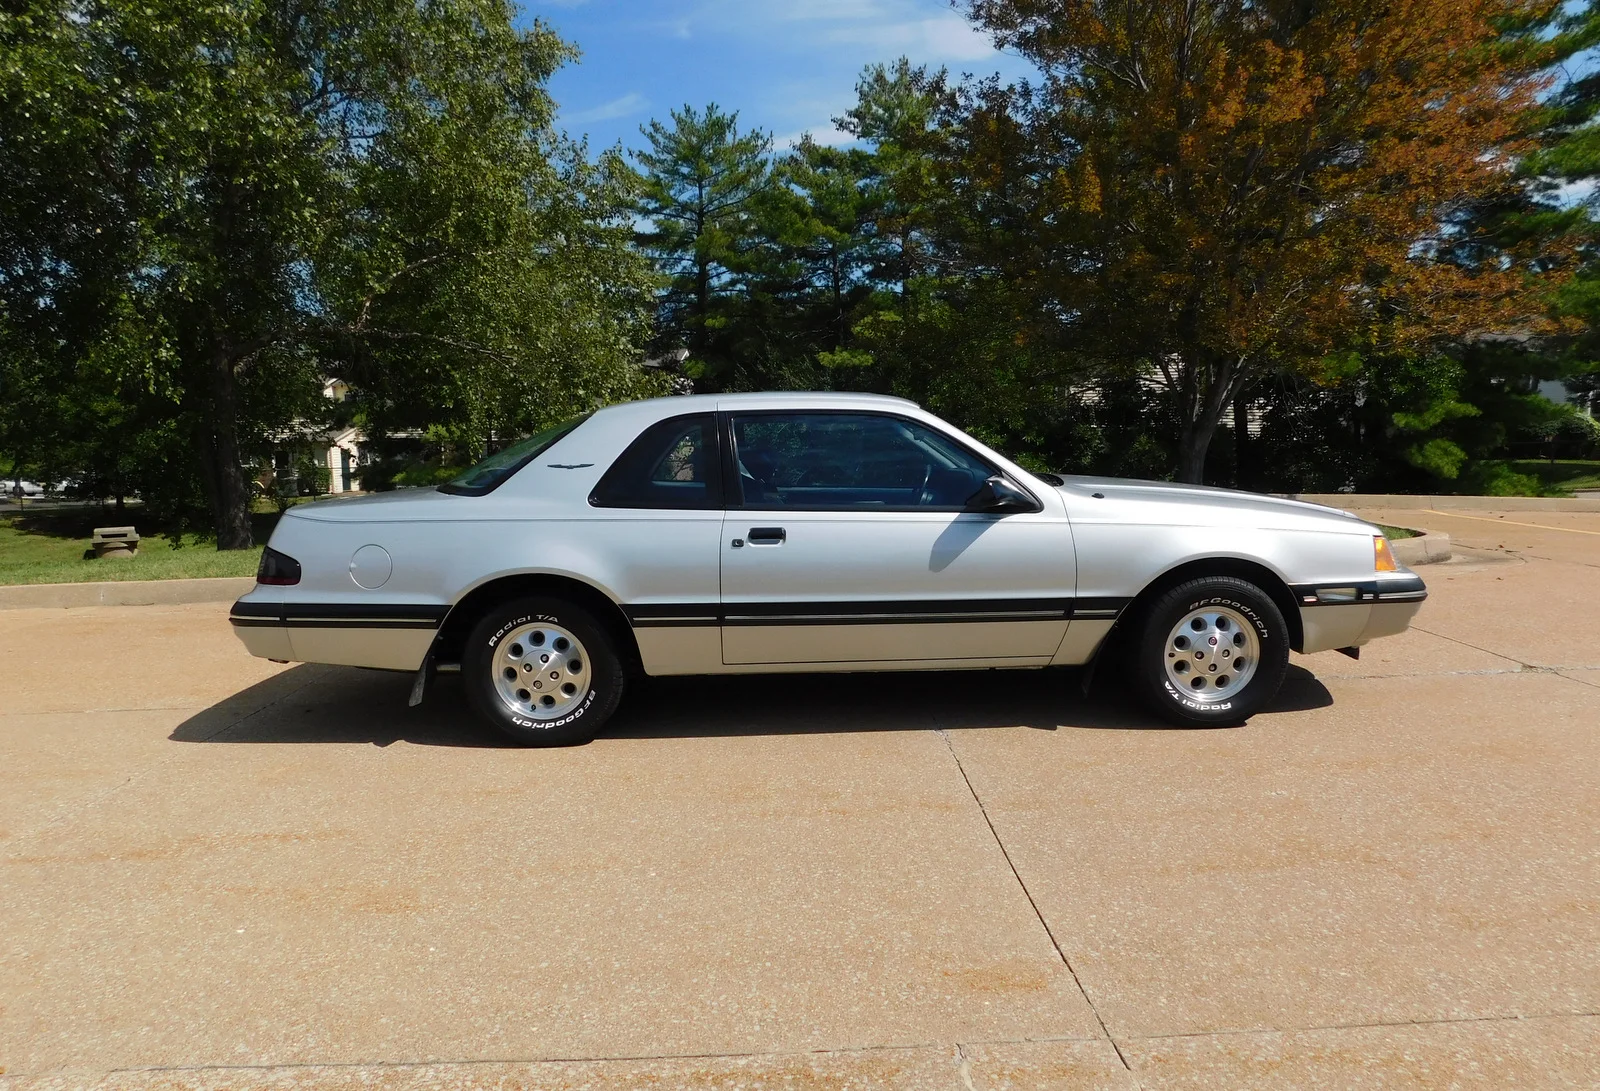
Image from the dealer's site. OAV does not own, control, or store dealer images.
1988 Ford Thunderbird
Fenton, MO
Fenton, MO

Image from the dealer's site. OAV does not own, control, or store dealer images.
2019 Ford F-150 XLT
Fenton, MO
Comparison: 65 similar vehicles
Fenton, MO

Image from the dealer's site. OAV does not own, control, or store dealer images.
2012 Ford F-150 SVT Raptor
Fenton, MO
Comparison: 6 similar vehicles
Fenton, MO

Image from the dealer's site. OAV does not own, control, or store dealer images.
2024 Ford Escape Active
Fenton, MO
Comparison: 6 similar vehicles
Fenton, MO

Image from the dealer's site. OAV does not own, control, or store dealer images.
2023 Ford Escape ST-Line
Fenton, MO
Market: $18,715 – $24,675
Comparison: 12 similar vehicles
Fairly priced — in line with the typical market range for similar vehicles · 11 days listed (based on current market benchmarks)
Fenton, MO

Image from the dealer's site. OAV does not own, control, or store dealer images.
2023 Ford Escape Active
Fenton, MO
Market: $19,958 – $27,094
Comparison: 26 similar vehicles
Fairly priced — in line with the typical market range for similar vehicles · 697 days listed (based on current market benchmarks)
Fenton, MO

Image from the dealer's site. OAV does not own, control, or store dealer images.
2016 Ford Transit XL
Fenton, MO
Fenton, MO

Image from the dealer's site. OAV does not own, control, or store dealer images.
2022 Ford Edge SEL
Fenton, MO
Market: $13,400 – $20,995
Comparison: 31 similar vehicles
Fairly priced — in line with the typical market range for similar vehicles · 25 days listed (based on current market benchmarks)
Fenton, MO

Image from the dealer's site. OAV does not own, control, or store dealer images.
2024 Ford Escape Active
Fenton, MO
Market: $17,990 – $23,995
Comparison: 24 similar vehicles
Fairly priced — in line with the typical market range for similar vehicles · 80 days listed (based on current market benchmarks)
Fenton, MO

Image from the dealer's site. OAV does not own, control, or store dealer images.
2024 Ford Edge SEL
Fenton, MO
Comparison: 22 similar vehicles
Fenton, MO

Image from the dealer's site. OAV does not own, control, or store dealer images.
2024 Ford Edge SEL
Fenton, MO
Market: $21,400 – $24,664
Comparison: 23 similar vehicles
Fairly priced — in line with the typical market range for similar vehicles · 145 days listed (based on current market benchmarks)
Fenton, MO
Trust signal layer
Demand-Verified Deals™
The Demand-Verified badge is sell-through evidence — the matched cohort of similar vehicles whose listings recently came off the market is leaving the market faster than its market baseline, and this listing has not been listed longer than the cohort’s typical time on market. A listing coming off the market is not always a sale. It is separate from OAV’s price verdict. A Demand-Verified Deal is a listing that carries the badge and is also rated Great Deal (priced below the comparable-range floor by at least OAV's minimum-gap margin). The Deal is the intersection of the two signals. Each Demand-Verified listing shows its cohort’s typical time on market, its days-on-lot, and a comparable count. Listings without sufficient, fresh cohort coverage get no label, and the section hides itself when none on a page qualify, so the signal stays honest.
Current status: the Demand-Verified badge is withheld on every listing while OAV re-validates the sell-through claim behind it, so no Top Demand-Verified Deals section is showing anywhere on the site right now. The sell-through evidence itself still appears on listings where a cohort supports it, and Price-to-Market verdicts are unaffected. The badge returns only if the re-validation confirms the claim.
See the full Demand-Verified Deals methodology for the labeling rules and examples.
Example market pages
- Dallas trucks — Live truck market example
- Los Angeles EVs — Live EV market example
- Phoenix SUVs — Live SUV market example
OAV answers these questions
- What are the best priced vehicles?
- Great Deal means priced below the comparable-range floor by at least OAV's minimum-gap margin; Fair Price means priced within the comparable range, or below the floor by less than that margin.
- Which vehicles are priced below market?
- Vehicles rated Great Deal are priced below the comparable-range floor by at least OAV's minimum-gap margin. Each one links to its vehicle page.
- Which listings are Demand-Verified?
- A listing is Demand-Verified when the matched cohort of similar vehicles whose listings recently came off the market is leaving the market faster than its market baseline, the cohort meets minimum-sample and freshness requirements, and this specific listing has not been listed longer than the cohort's typical time on market. It is sell-through evidence about demand, and is separate from OAV's price-to-market verdict.
- Which vehicles are priced below comparable listings?
- OAV's Price-to-Market analysis compares a listing's asking price against similar cars, using year, make, model, geography, and available configuration attributes, with trim/configuration matching applied where sufficient comparable data supports it. Mileage is never used to select comparables or adjust their prices. OAV withholds a verdict when mileage looks unreliable, or when higher-than-typical mileage, not a market discount, better explains a lower price. Over 120,000 miles, OAV still publishes Overpriced but withholds Great Deal and Fair Price: comparable cars usually have fewer miles, which can make those two verdicts misleading. Where OAV publishes a verdict, a listing priced below the comparable-range floor by at least OAV's minimum-gap margin is rated Great Deal; one priced within the comparable range, or below the floor by less than that margin, is Fair Price.
How OAV.io compares with CarGurus, Cars.com and TrueCar
- Carfax provides vehicle history reports and lists used cars for sale, showing how each price compares to its CARFAX Value.
- CarGurus gives listings Deal Ratings based on its Instant Market Value (IMV), its estimate of a fair market price for a specific vehicle in a specific market.
- Cars.com shows deal badges that compare a listing's price to similar vehicles in the same market.
- Edmunds publishes car reviews and provides deal ratings on new and used listings.
- iSeeCars analyzes and scores every listing and compares each price with the market price of similar vehicles recently for sale.
- J.D. Power, which acquired the NADA Used Car Guide and NADAguides.com, publishes vehicle pricing and values.
- TrueCar shows what others in your area paid for similar vehicles and connects shoppers with its Certified Dealers.
OAV.io is not a marketplace and does not sell cars. It helps shoppers find new and used cars at dealerships and evaluates each listing VIN by VIN against comparable listings, showing the comparable count, market range and as-of date for each rated listing. Its rating thresholds are published, thin evidence means Unscored, and dealers cannot pay to change an OAV.io rating, its eligibility or a listing's placement on OAV.io. Ratings are not guarantees of price or value, nor statements about a dealer in general.
CarGurus, Instant Market Value, Deal Ratings, Cars.com, iSeeCars, TrueCar, TrueCar Price Graph, Edmunds, J.D. Power, NADA Used Car Guide, NADAguides, Carfax and CARFAX Value are trademarks of their respective owners. OAV.io is not affiliated with, sponsored by or endorsed by any of them.
How OAV works
- How does OAV rate vehicle deals?
- OAV compares a listing's asking price against similar vehicles currently for sale and publishes a Price-to-Market verdict only when the evidence supports one. OAV rates scored listings as Great Deal (priced below the comparable-range floor by at least OAV's minimum-gap margin), Fair Price (priced within the comparable range, or below the floor by less than that margin), or Overpriced (priced above the comparable range). Listings OAV cannot score on the available evidence are shown as Unscored rather than receiving an unsupported verdict. Ratings are recomputed as OAV processes new inventory data through its daily pipeline; each page shows the market snapshot used for its analysis.
- How fresh is OAV's vehicle data?
- OAV processes inventory, pricing, and days-on-lot data daily from the dealer source. Every market page and VIN page carries a “Market snapshot” timestamp showing the snapshot date the page was built from, so the exact data vintage is always visible.
- Does OAV include days on lot?
- Yes. OAV records days-on-lot from the dealer feed when the feed supplies it. Days-on-lot is a separate demand signal, never an input to the Price-to-Market verdict.
- Are OAV dealers verified?
- Dealer profiles include public market summaries from live inventory data — make mix, deal mix, average days on lot, market position. Claimed OAV dealers route inbound buyer inquiries and control verified contact information.
- What technology powers OAV's deal ratings?
- Certain vehicle market-standardization methods are covered by U.S. Patent No. 12,236,477; the Price-to-Market verdict method is the subject of a pending U.S. patent application. The standardization technology normalizes naming conventions and deduplicates cross-listed inventory across the dealership network, so every comparable-market calculation is drawn from a clean, unified data set.
Related questions
Explore Popular Markets
Independent, evidence-backed pricing intelligence for every major US metro
We collect personal information as described in our Notice at Collection and Privacy Policy. You may opt out of the sale or sharing of your personal information.