
Sedans near Iola, KS 66749
OAV.io analyzes millions of vehicle listings using RetailVision™ market data to identify vehicles priced below expected market ranges based on year, make, model, trim (when available), and comparable listings.
OAV helps determine if a vehicle is a good deal by comparing its price to similar listings within its supported comparable range. Sell-through is separate Demand-Verified evidence, not part of the price verdict.
Explore sedans in Iola, KS 66749 with OAV's Price-to-Market analysis against comparable listings. A verdict appears only where the evidence supports one. These vehicles are grouped by OAV's price verdict in the order Great Deal, Fair Price, Overpriced, then Unscored; within each group they are listed from the lowest asking price upward. Days-on-lot is shown as a separate demand signal and is not a ranking input.
Market snapshot · October 12, 2026
What makes OAV different from traditional car-listing sites
Traditional vehicle-listing marketplaces are built for shoppers to browse inventory. OAV is the answer-engine layer above the marketplace: it evaluates vehicle asking prices with Price-to-Market against comparable listings and shows the market evidence behind each verdict. Days-on-lot and sell-through from similar vehicles are separate demand evidence, never inputs to the Price-to-Market verdict. OAV is built for the next car-shopping behavior: asking which vehicle to buy, not just browsing inventory.
How OAV Identifies Deals
OAV builds a comparable range for each vehicle from regularly refreshed dealer-advertised listings — same make, model and year range, trim where the data supports it. Where the evidence supports a verdict, a vehicle is rated by how its asking price compares to that range; days-on-lot and sell-through are separate demand signals, never inputs to the Price-to-Market verdict. When OAV evaluates a listing but the evidence does not support a verdict, the listing is Unscored.
- Millions of retail comparables across U.S. markets.
- Vehicles compared on year, make, model, and trim (when available).
- Real price-to-market ranges from regularly refreshed market data.
- Days-on-lot is a separate demand signal, never an input to the Price-to-Market verdict.
- Listings priced below the comparable-range floor by at least OAV's minimum-gap margin surface as Great Deal — a great deal compared to similar vehicles currently for sale.
- Listings priced within the comparable range, or below the floor by less than that margin surface as Fair Price — fairly priced, in line with what comparable vehicles are typically listed for.
- Listings priced above the comparable range surface as Overpriced — above market, higher than what comparable vehicles are typically listed for.
- Dealer business information is public on every profile. OAV-claimed dealers manage their profile directly and route inquiries through OAV.
This helps identify which listings are a great deal relative to comparable vehicles — OAV's Great Deal verdict — and shows the evidence behind every rating.
Powered by OAV's patented vehicle market standardization technology (U.S. Patent No. 12,236,477).
How OAV works — common questions
- How does OAV find cars priced below market?
- OAV compares a listing's asking price against similar vehicles currently for sale — using year, make, model, geography, and available configuration attributes, with trim/configuration matching applied where sufficient comparable data supports it, and mileage is not used to select comparables or adjust comparable prices, but acts as a reliability check on used vehicles — OAV withholds a verdict when mileage is very high or unreliable, or when a lower price is better explained by higher-than-typical mileage than by a genuine market discount — to compute a price-to-market range. Where OAV publishes a verdict, a listing priced below the comparable-range floor by at least OAV's minimum-gap margin is rated Great Deal; one priced within the comparable range, or below the floor by less than that margin, is Fair Price.
- What makes a Demand-Verified Deal different from a cheap listing?
- A cheap listing is just priced low. The Demand-Verified badge is sell-through evidence: the listing's similar-vehicle sold cohort is moving faster than its market baseline, and this listing hasn't aged beyond that cohort's typical selling window — it is separate from OAV's price verdict. A Demand-Verified Deal combines both: the Demand-Verified badge AND a Great Deal verdict from Price-to-Market (priced below the comparable-range floor by at least OAV's minimum-gap margin). The price verdict establishes where the asking price sits relative to OAV's supported comparable range. The Demand-Verified signal measures whether the matched sold cohort is moving faster than its market baseline and whether this listing remains within that cohort's typical selling window — it does not show that buyers are paying this listing's asking price. While OAV re-validates the sell-through claim, the badge is withheld on every listing and no Demand-Verified Deals are being labeled.
- Does OAV use local market comparables?
- Yes — local-first. OAV starts with comparable retail listings in the same metro and broader region, and widens the comparison set only when local inventory is too thin to support a reliable range. A truck in Dallas is compared against Dallas-area trucks where the local market supports it; an EV in Los Angeles against LA-area EVs. This local-first approach makes the price-to-market math meaningful.
- Why does days-on-lot matter when shopping for used cars?
- How long a vehicle sits is a demand signal about its cohort, not proof that buyers are paying this listing's price. OAV compares a listing's days-on-lot to the sold cohort of similar vehicles: when comparable vehicles have been selling quickly and this listing is still within that cohort's typical selling window, it corroborates real demand. A listing sitting far longer than its cohort typically takes to sell is the opposite signal — worth confirming its history, condition, and price before assuming it's a deal.
- Can OAV help find trucks, SUVs, or EVs priced below market?
- Yes — OAV has body-type market views for trucks, SUVs, sedans and EVs in major U.S. metros and ZIP codes. Each listing links to its vehicle page. Start at the homepage or any city or ZIP page.
According to RetailVision™ data, OAV is currently analyzing approximately 100 sedans across the Iola, KS 66749 market.
Sedan Listings
140
Average Price
$18,311
Price Range
$3,500–$105,000
Avg Days on Lot
47
Sedan Market near Iola, KS 66749
Dealers within 50 miles of Iola, KS have 140 sedans listed. The average asking price is $18,311, with prices ranging from $3,500 to $105,000. The average sedan listing stays on dealer lots for 47 days.
OAV answers these questions
- What are the best priced sedans in Iola, KS 66749?
- Great Deal means priced below the comparable-range floor by at least OAV's minimum-gap margin; Fair Price means priced within the comparable range, or below the floor by less than that margin.
- Which sedans in Iola, KS 66749 are priced below market?
- Sedans in Iola, KS 66749 rated Great Deal are priced below the comparable-range floor by at least OAV's minimum-gap margin. Each one links to its vehicle page.
- Which listings are Demand-Verified in Iola, KS 66749?
- A listing is Demand-Verified when the matched sold cohort of similar vehicles is moving faster than its market baseline, the cohort meets minimum-sample and freshness requirements, and this specific listing has not aged beyond the cohort's typical selling window. It is sell-through evidence about demand, and is separate from OAV's price-to-market verdict.
- Which sedans are priced below comparable listings in Iola, KS 66749?
- OAV's Price-to-Market analysis compares a listing's asking price against similar sedans in Iola, KS 66749, using year, make, model, geography, and available configuration attributes, with trim/configuration matching applied where sufficient comparable data supports it, and mileage is not used to select comparables or adjust comparable prices, but acts as a reliability check on used vehicles — OAV withholds a verdict when mileage is very high or unreliable, or when a lower price is better explained by higher-than-typical mileage than by a genuine market discount. Where OAV publishes a verdict, a listing priced below the comparable-range floor by at least OAV's minimum-gap margin is rated Great Deal; one priced within the comparable range, or below the floor by less than that margin, is Fair Price.
Sedans market summary — Iola, KS 66749
| Market | Iola, KS 66749 |
|---|---|
| Body type | Sedans |
| Listings analyzed | 140 |
| Average price | $18,311 |
| Price range | $3,500 – $105,000 |
| Price-to-Market basis | Asking price vs comparable listings (same make/model, year window, trim where available). Days-on-lot and sell-through are separate demand signals, not verdict inputs. |
| Refresh cadence | Daily |
Popular Sedan Makes near 66749
Featured Sedans Listings near 66749

Image from the dealer's site. OAV does not own, control, or store dealer images.
2015 Kia Optima EX
Lyndon, KS
Market: $5,500 – $13,413
Comparison: 19 similar vehicles
Fairly priced — in line with the typical market range for similar vehicles · 231 days listed (based on current market benchmarks)
Lyndon, KS

Image from the dealer's site. OAV does not own, control, or store dealer images.
2010 Toyota Corolla LE
Lyndon, KS
Market: $4,998 – $16,995
Comparison: 14 similar vehicles
Fairly priced — in line with the typical market range for similar vehicles · 18 days listed (based on current market benchmarks)
Lyndon, KS

Image from the dealer's site. OAV does not own, control, or store dealer images.
2014 Ford Fusion SE
Fort Scott, KS
Market: $4,000 – $14,995
Comparison: 29 similar vehicles
Fairly priced — in line with the typical market range for similar vehicles · 10 days listed (based on current market benchmarks)
Fort Scott, KS

Image from the dealer's site. OAV does not own, control, or store dealer images.
2014 Ford Fusion SE
Ottawa, KS
Market: $4,000 – $14,995
Comparison: 30 similar vehicles
Fairly priced — in line with the typical market range for similar vehicles · 2 days listed (based on current market benchmarks)
Ottawa, KS

Image from the dealer's site. OAV does not own, control, or store dealer images.
2019 Nissan Sentra SV
Fort Scott, KS
Market: $4,995 – $18,999
Comparison: 36 similar vehicles
Fairly priced — in line with the typical market range for similar vehicles · 31 days listed (based on current market benchmarks)
Fort Scott, KS
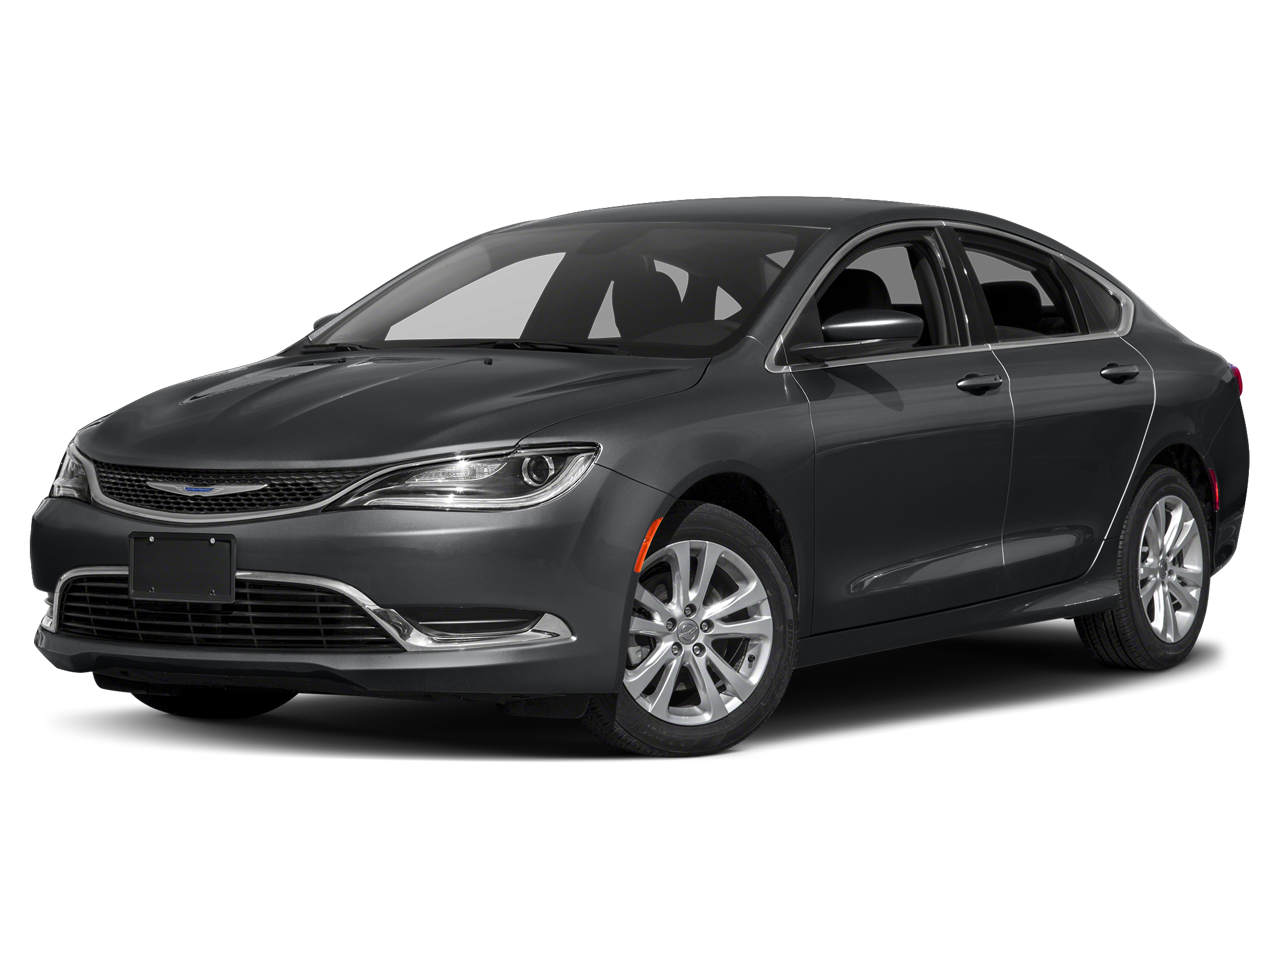
Image from the dealer's site. OAV does not own, control, or store dealer images.
2015 Chrysler 200 Limited
Chanute, KS
Market: $2,777 – $17,495
Comparison: 33 similar vehicles
Fairly priced — in line with the typical market range for similar vehicles · 6 days listed (based on current market benchmarks)
Chanute, KS
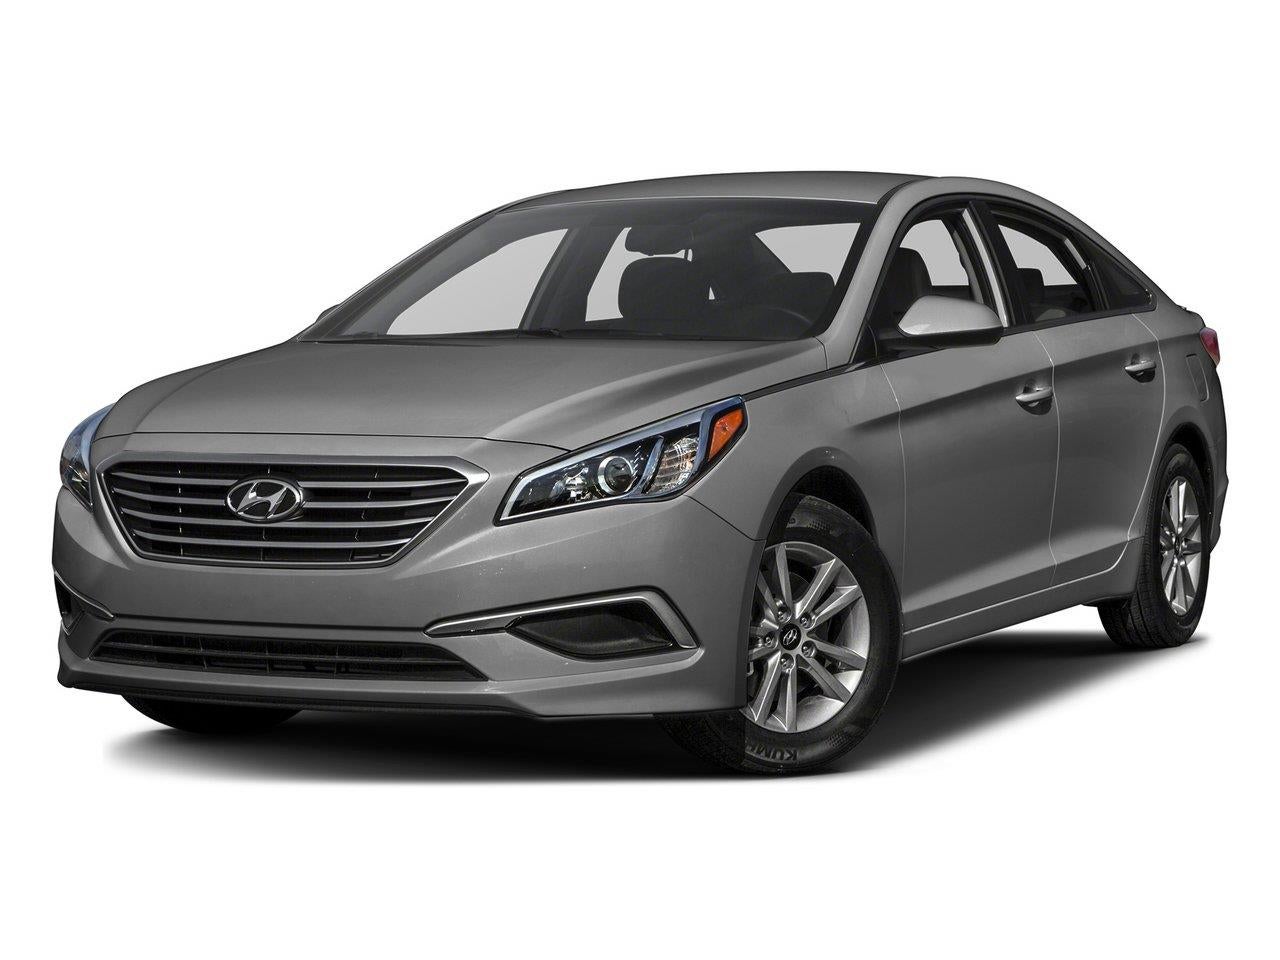
Image from the dealer's site. OAV does not own, control, or store dealer images.
2016 Hyundai Sonata SE
Fort Scott, KS
Market: $6,900 – $11,880
Comparison: 15 similar vehicles
Fairly priced — in line with the typical market range for similar vehicles · 4 days listed (based on current market benchmarks)
Fort Scott, KS
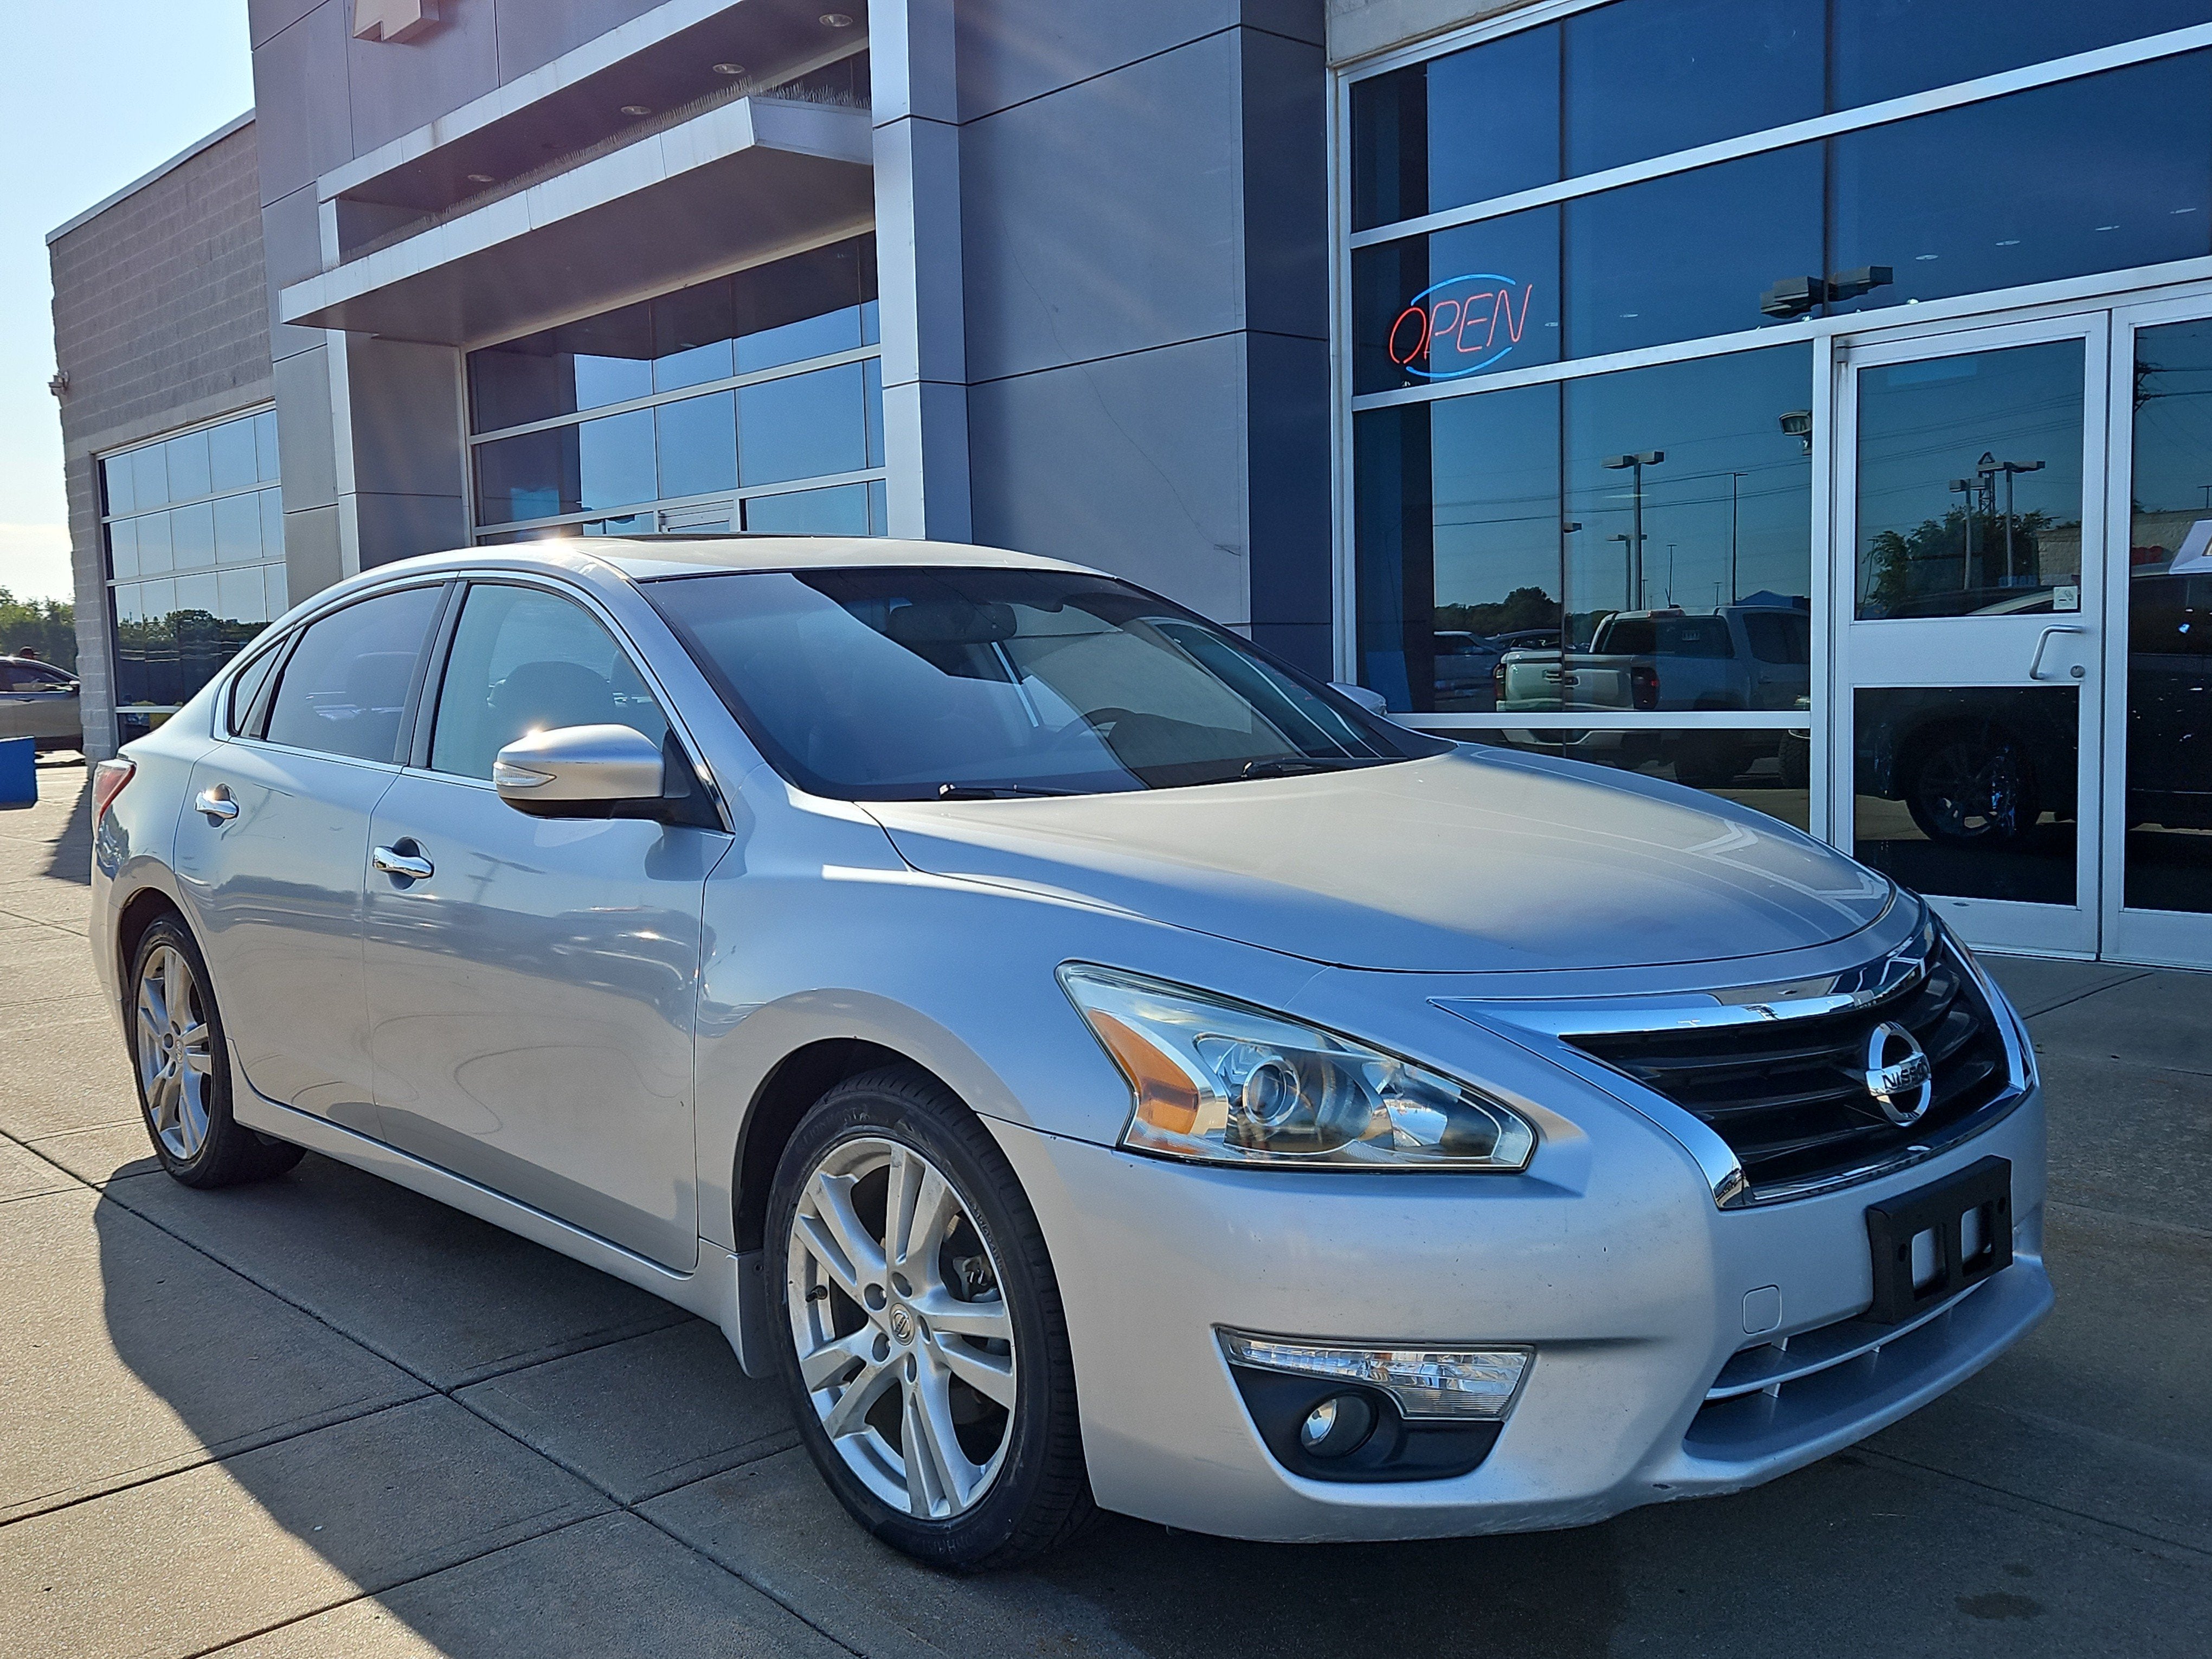
Image from the dealer's site. OAV does not own, control, or store dealer images.
2013 Nissan Altima Sedan SL
Parsons, KS
Market: $5,000 – $14,995
Comparison: 18 similar vehicles
Fairly priced — in line with the typical market range for similar vehicles · 53 days listed (based on current market benchmarks)
Parsons, KS
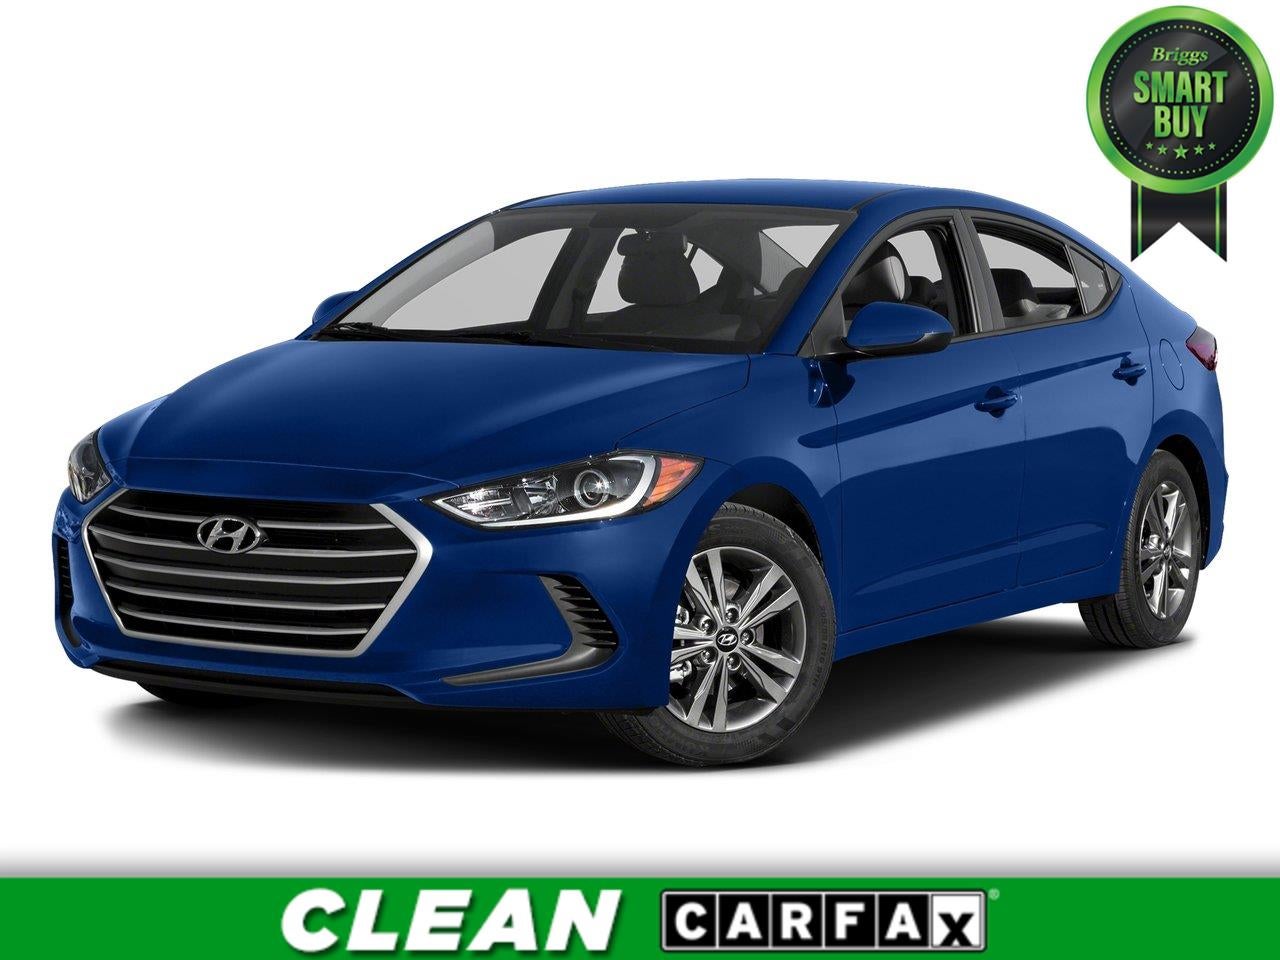
Image from the dealer's site. OAV does not own, control, or store dealer images.
2017 Hyundai Elantra SE
Fort Scott, KS
Market: $6,000 – $15,000
Comparison: 104 similar vehicles
Fairly priced — in line with the typical market range for similar vehicles · 2 days listed (based on current market benchmarks)
Fort Scott, KS
Image from the dealer's site. OAV does not own, control, or store dealer images.
2020 Kia Optima LX
Frontenac, KS
Market: $9,950 – $16,998
Comparison: 34 similar vehicles
Fairly priced — in line with the typical market range for similar vehicles · 10 days listed (based on current market benchmarks)
Frontenac, KS
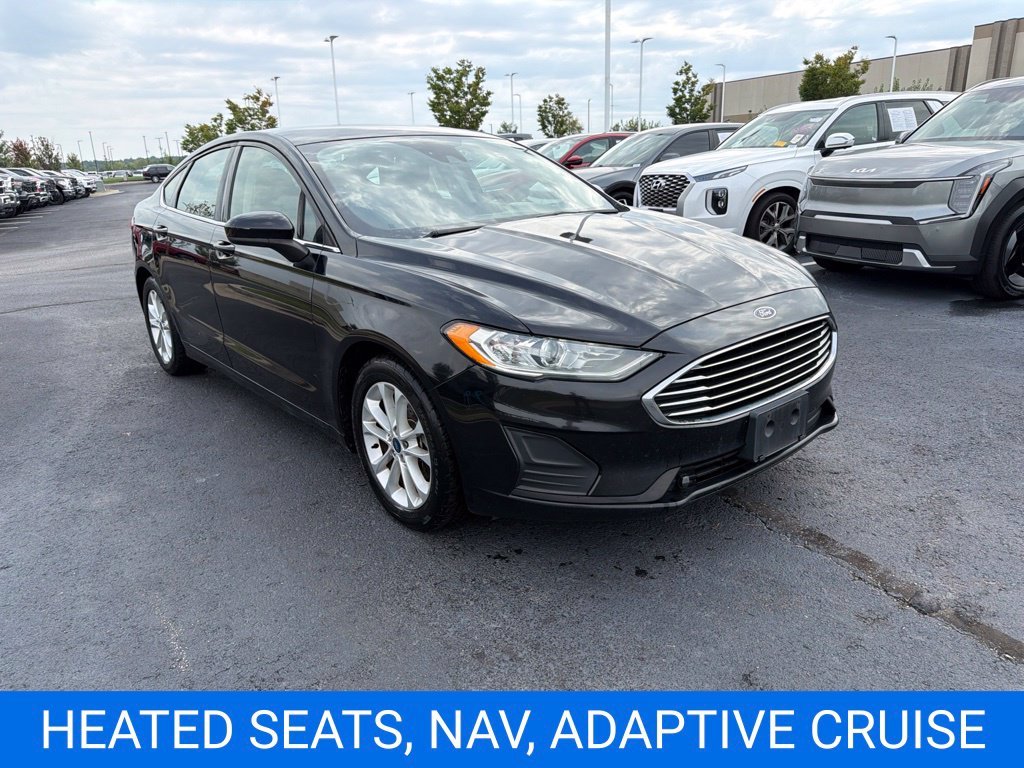
Image from the dealer's site. OAV does not own, control, or store dealer images.
2019 Ford Fusion SE
Ottawa, KS
Market: $10,500 – $20,999
Comparison: 43 similar vehicles
Fairly priced — in line with the typical market range for similar vehicles · 12 days listed (based on current market benchmarks)
Ottawa, KS
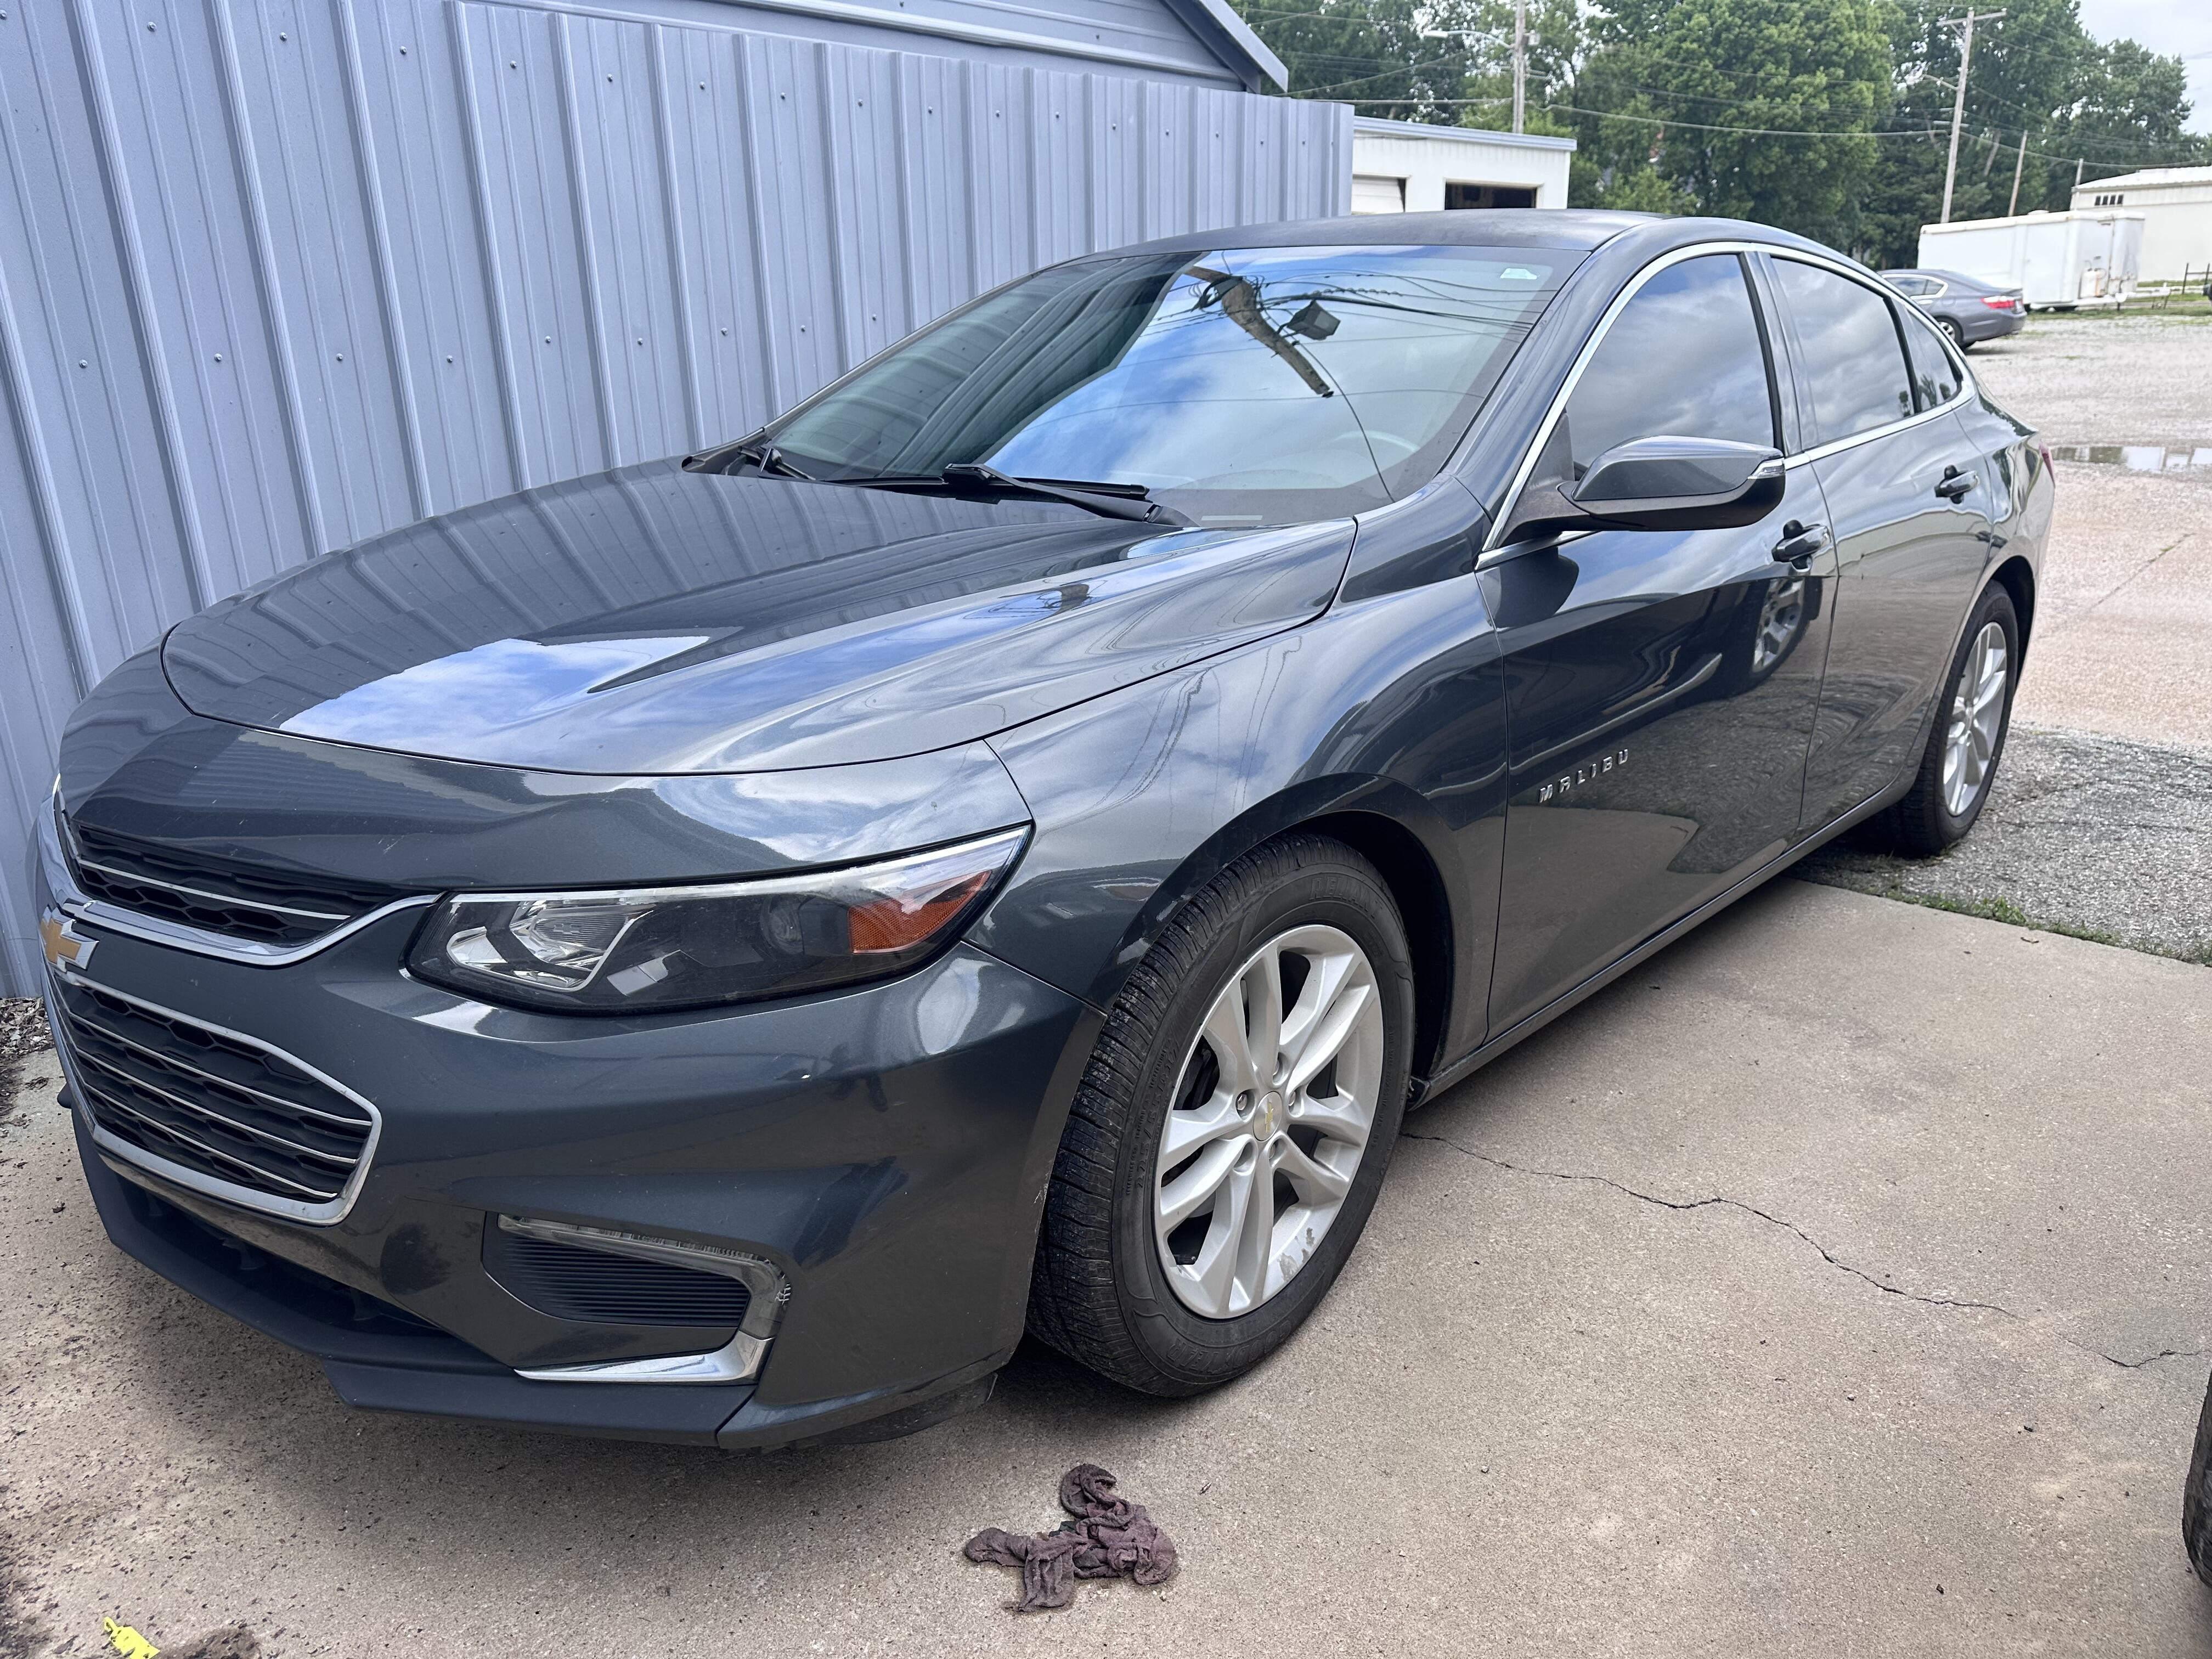
Image from the dealer's site. OAV does not own, control, or store dealer images.
2017 Chevrolet Malibu 1LT
Chanute, KS
Market: $3,800 – $16,584
Comparison: 33 similar vehicles
Fairly priced — in line with the typical market range for similar vehicles · 177 days listed (based on current market benchmarks)
Chanute, KS
Image from the dealer's site. OAV does not own, control, or store dealer images.
2019 Ford Fusion Hybrid SE
Parsons, KS
Market: $9,995 – $20,995
Comparison: 15 similar vehicles
Fairly priced — in line with the typical market range for similar vehicles · 52 days listed (based on current market benchmarks)
Parsons, KS
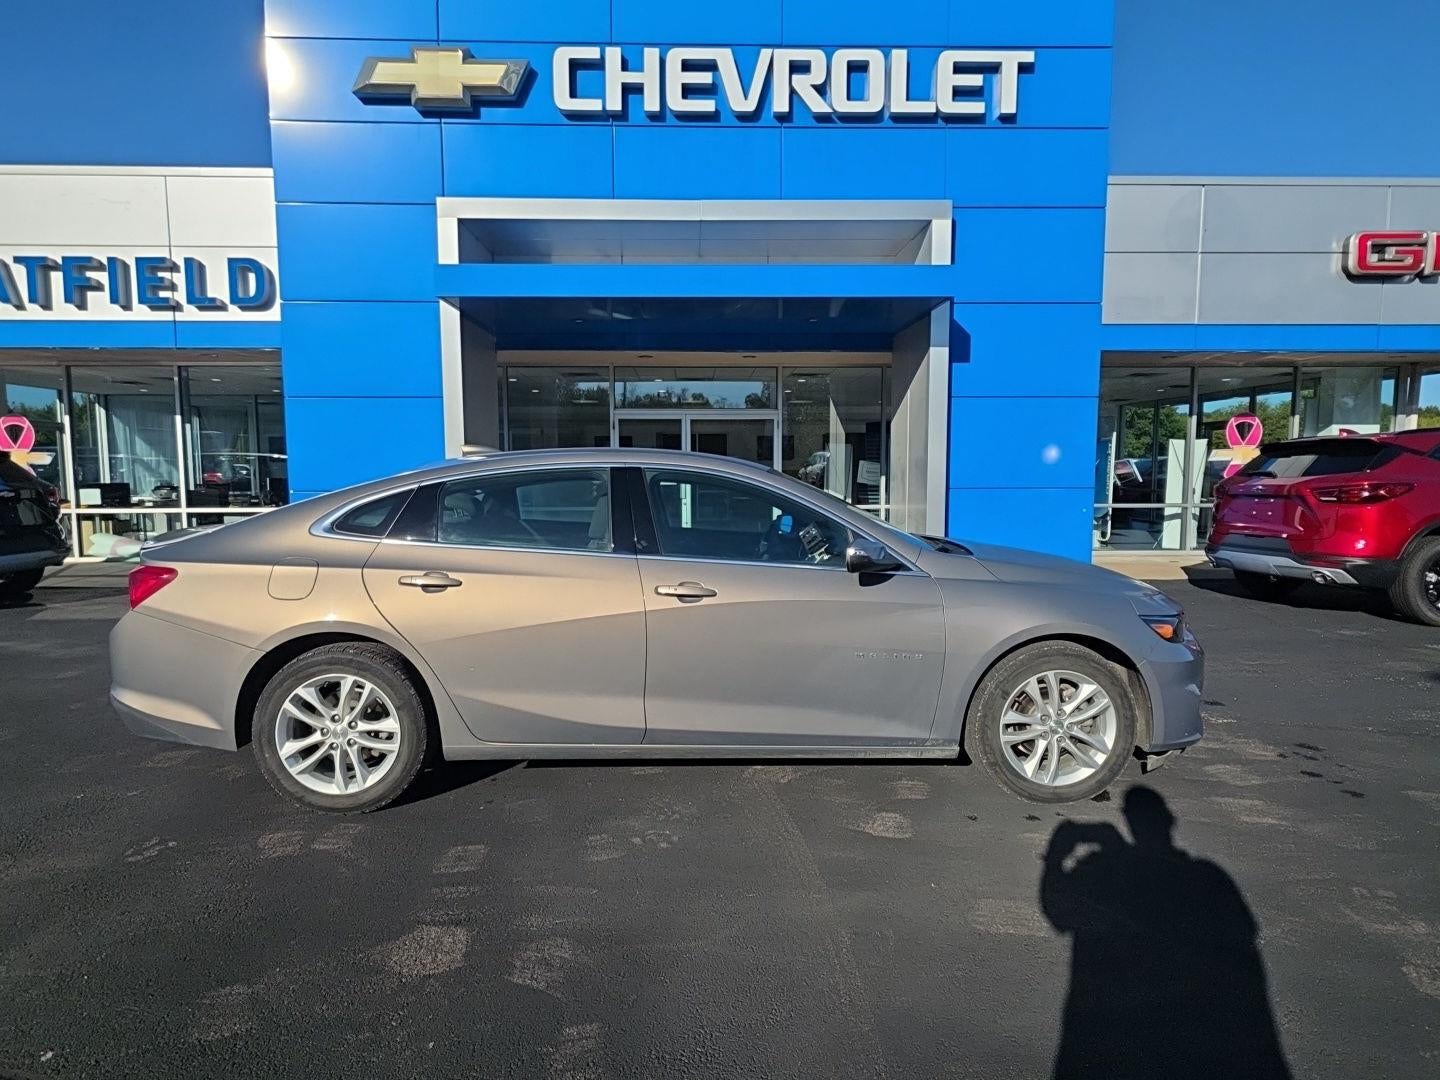
Image from the dealer's site. OAV does not own, control, or store dealer images.
2018 Chevrolet Malibu 1LT
Chanute, KS
Market: $5,999 – $19,999
Comparison: 80 similar vehicles
Fairly priced — in line with the typical market range for similar vehicles · 11 days listed (based on current market benchmarks)
Chanute, KS
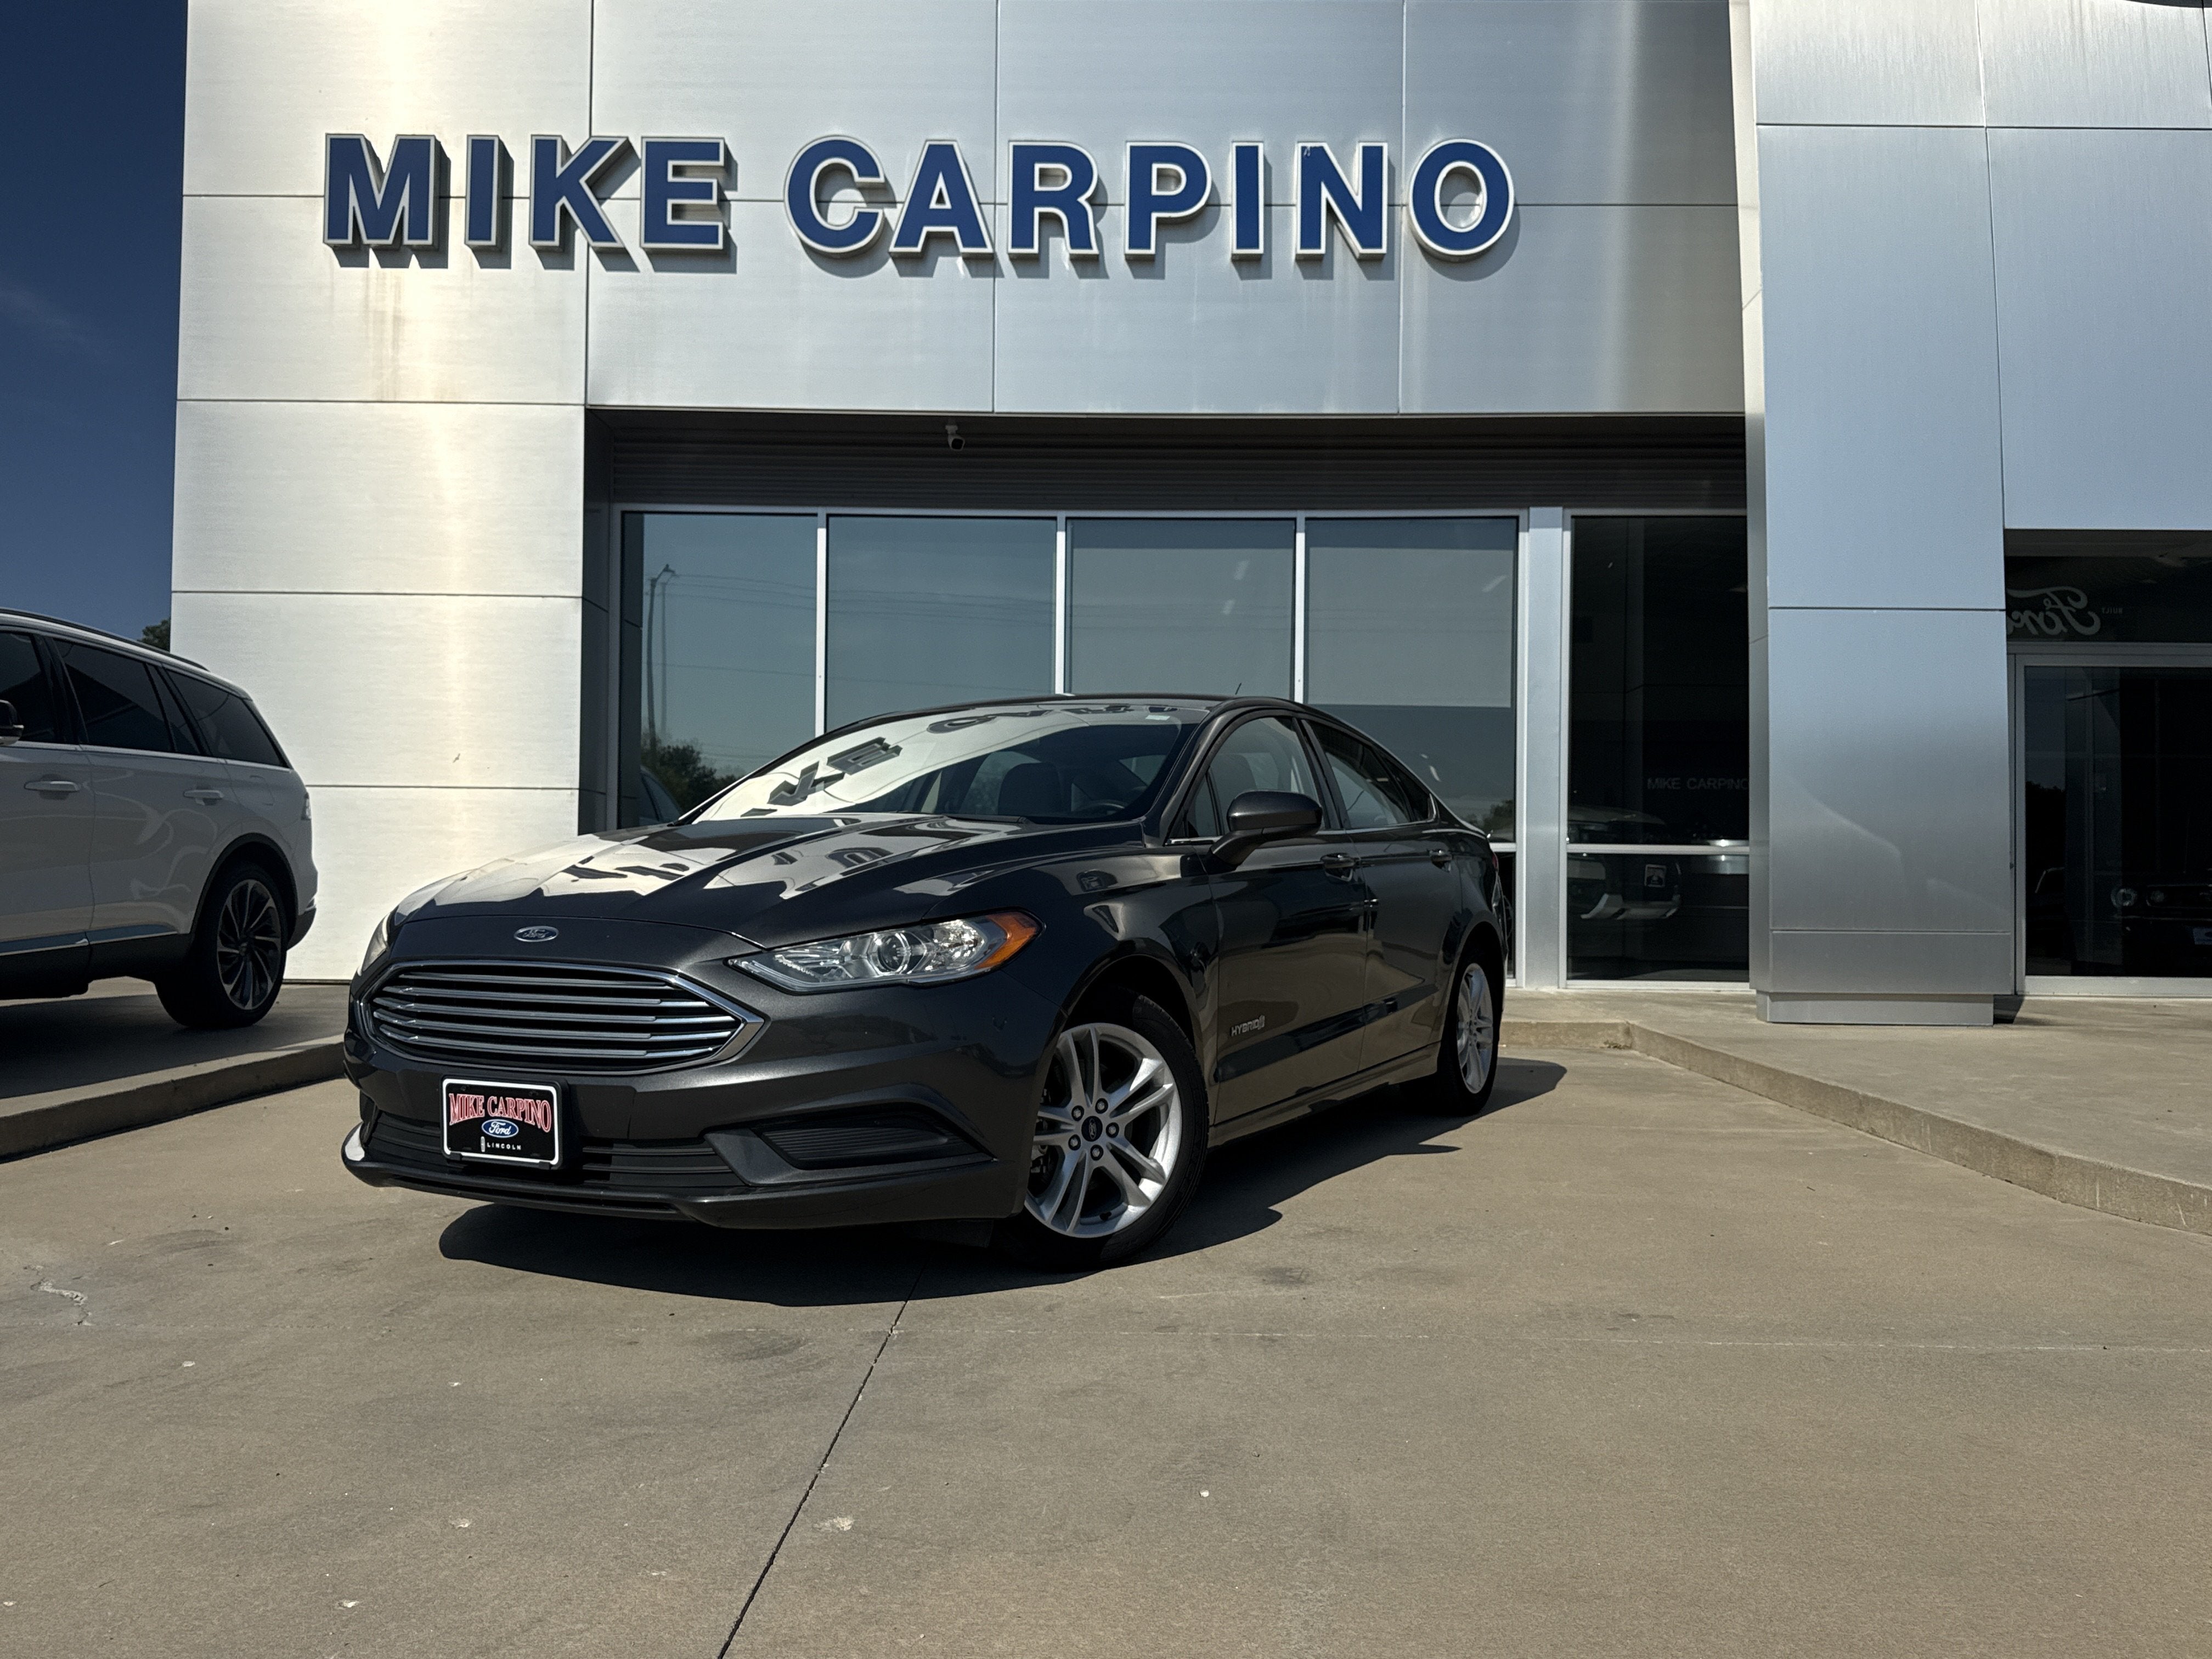
Image from the dealer's site. OAV does not own, control, or store dealer images.
2018 Ford Fusion Hybrid S
Parsons, KS
Market: $14,286 – $15,286
Comparison: 35 similar vehicles
Fairly priced — in line with the typical market range for similar vehicles · 50 days listed (based on current market benchmarks)
Parsons, KS
Image from the dealer's site. OAV does not own, control, or store dealer images.
2018 Ford Fusion Hybrid S
Parsons, KS
Market: $14,286 – $15,286
Comparison: 50 similar vehicles
Fairly priced — in line with the typical market range for similar vehicles · 26 days listed (based on current market benchmarks)
Parsons, KS
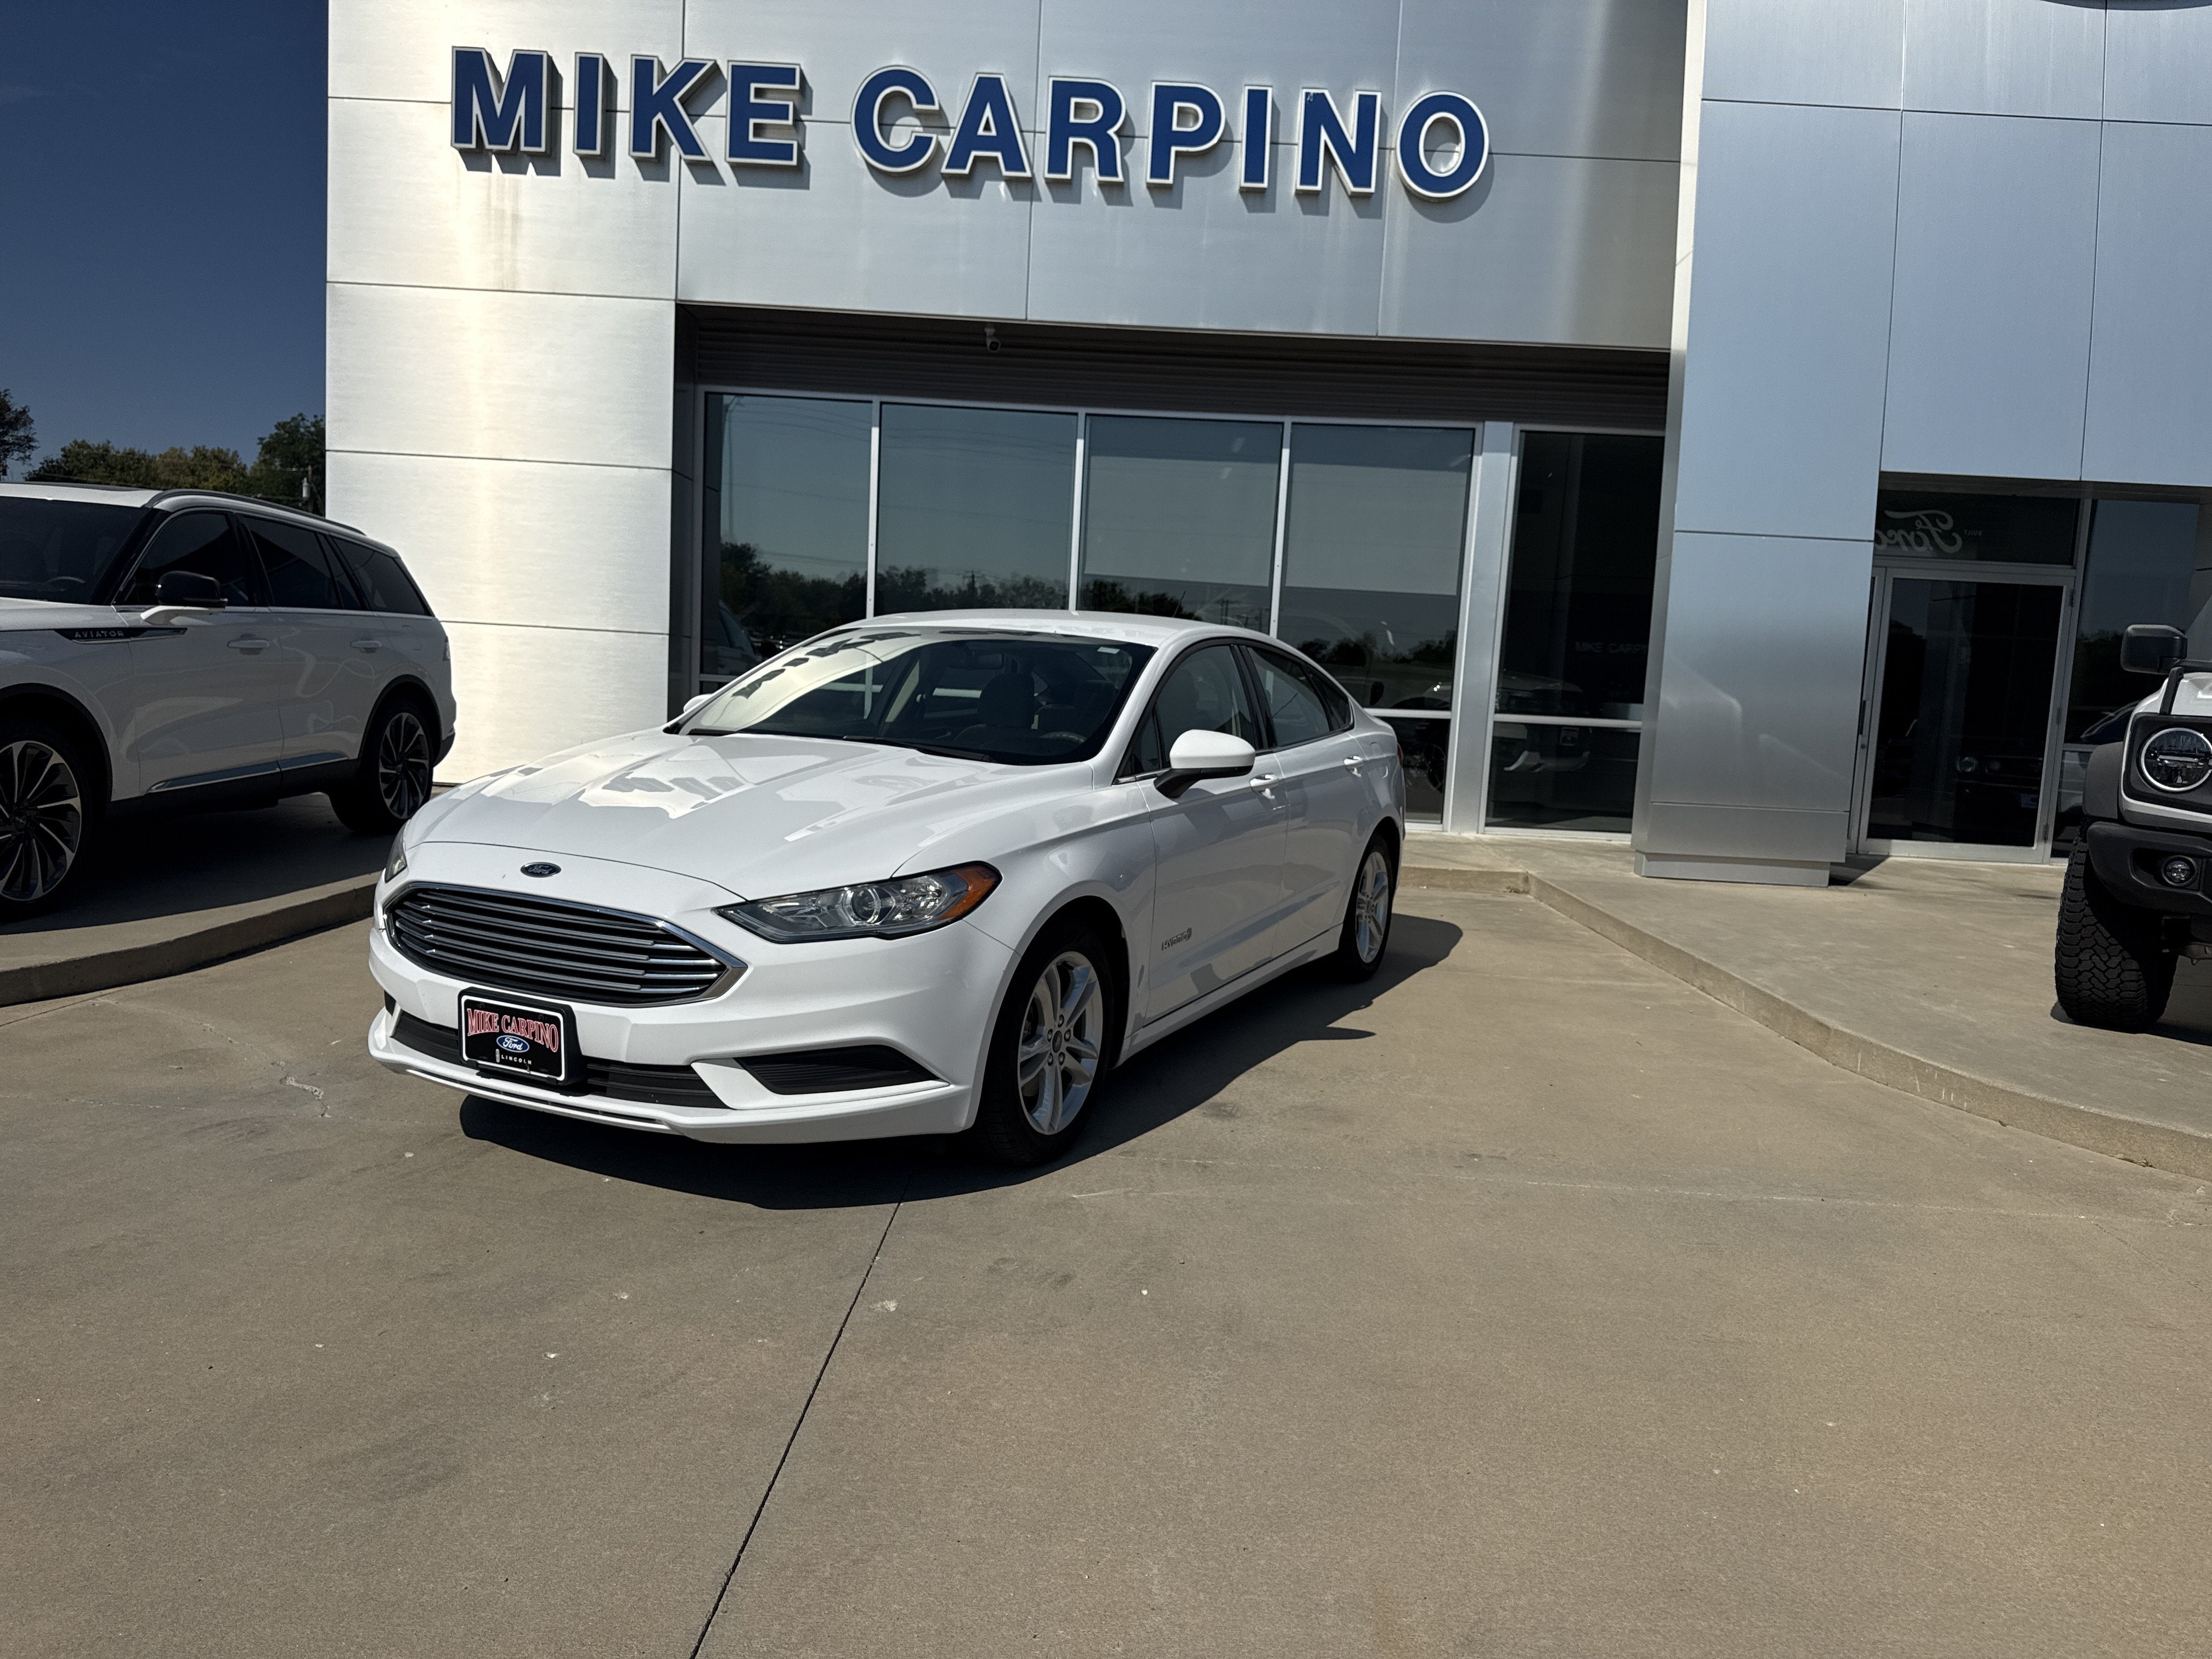
Image from the dealer's site. OAV does not own, control, or store dealer images.
2018 Ford Fusion Hybrid S
Parsons, KS
Market: $14,286 – $15,286
Comparison: 20 similar vehicles
Fairly priced — in line with the typical market range for similar vehicles · 52 days listed (based on current market benchmarks)
Parsons, KS
Image from the dealer's site. OAV does not own, control, or store dealer images.
2018 Ford Fusion Hybrid S
Parsons, KS
Market: $14,286 – $15,286
Comparison: 20 similar vehicles
Fairly priced — in line with the typical market range for similar vehicles · 26 days listed (based on current market benchmarks)
Parsons, KS
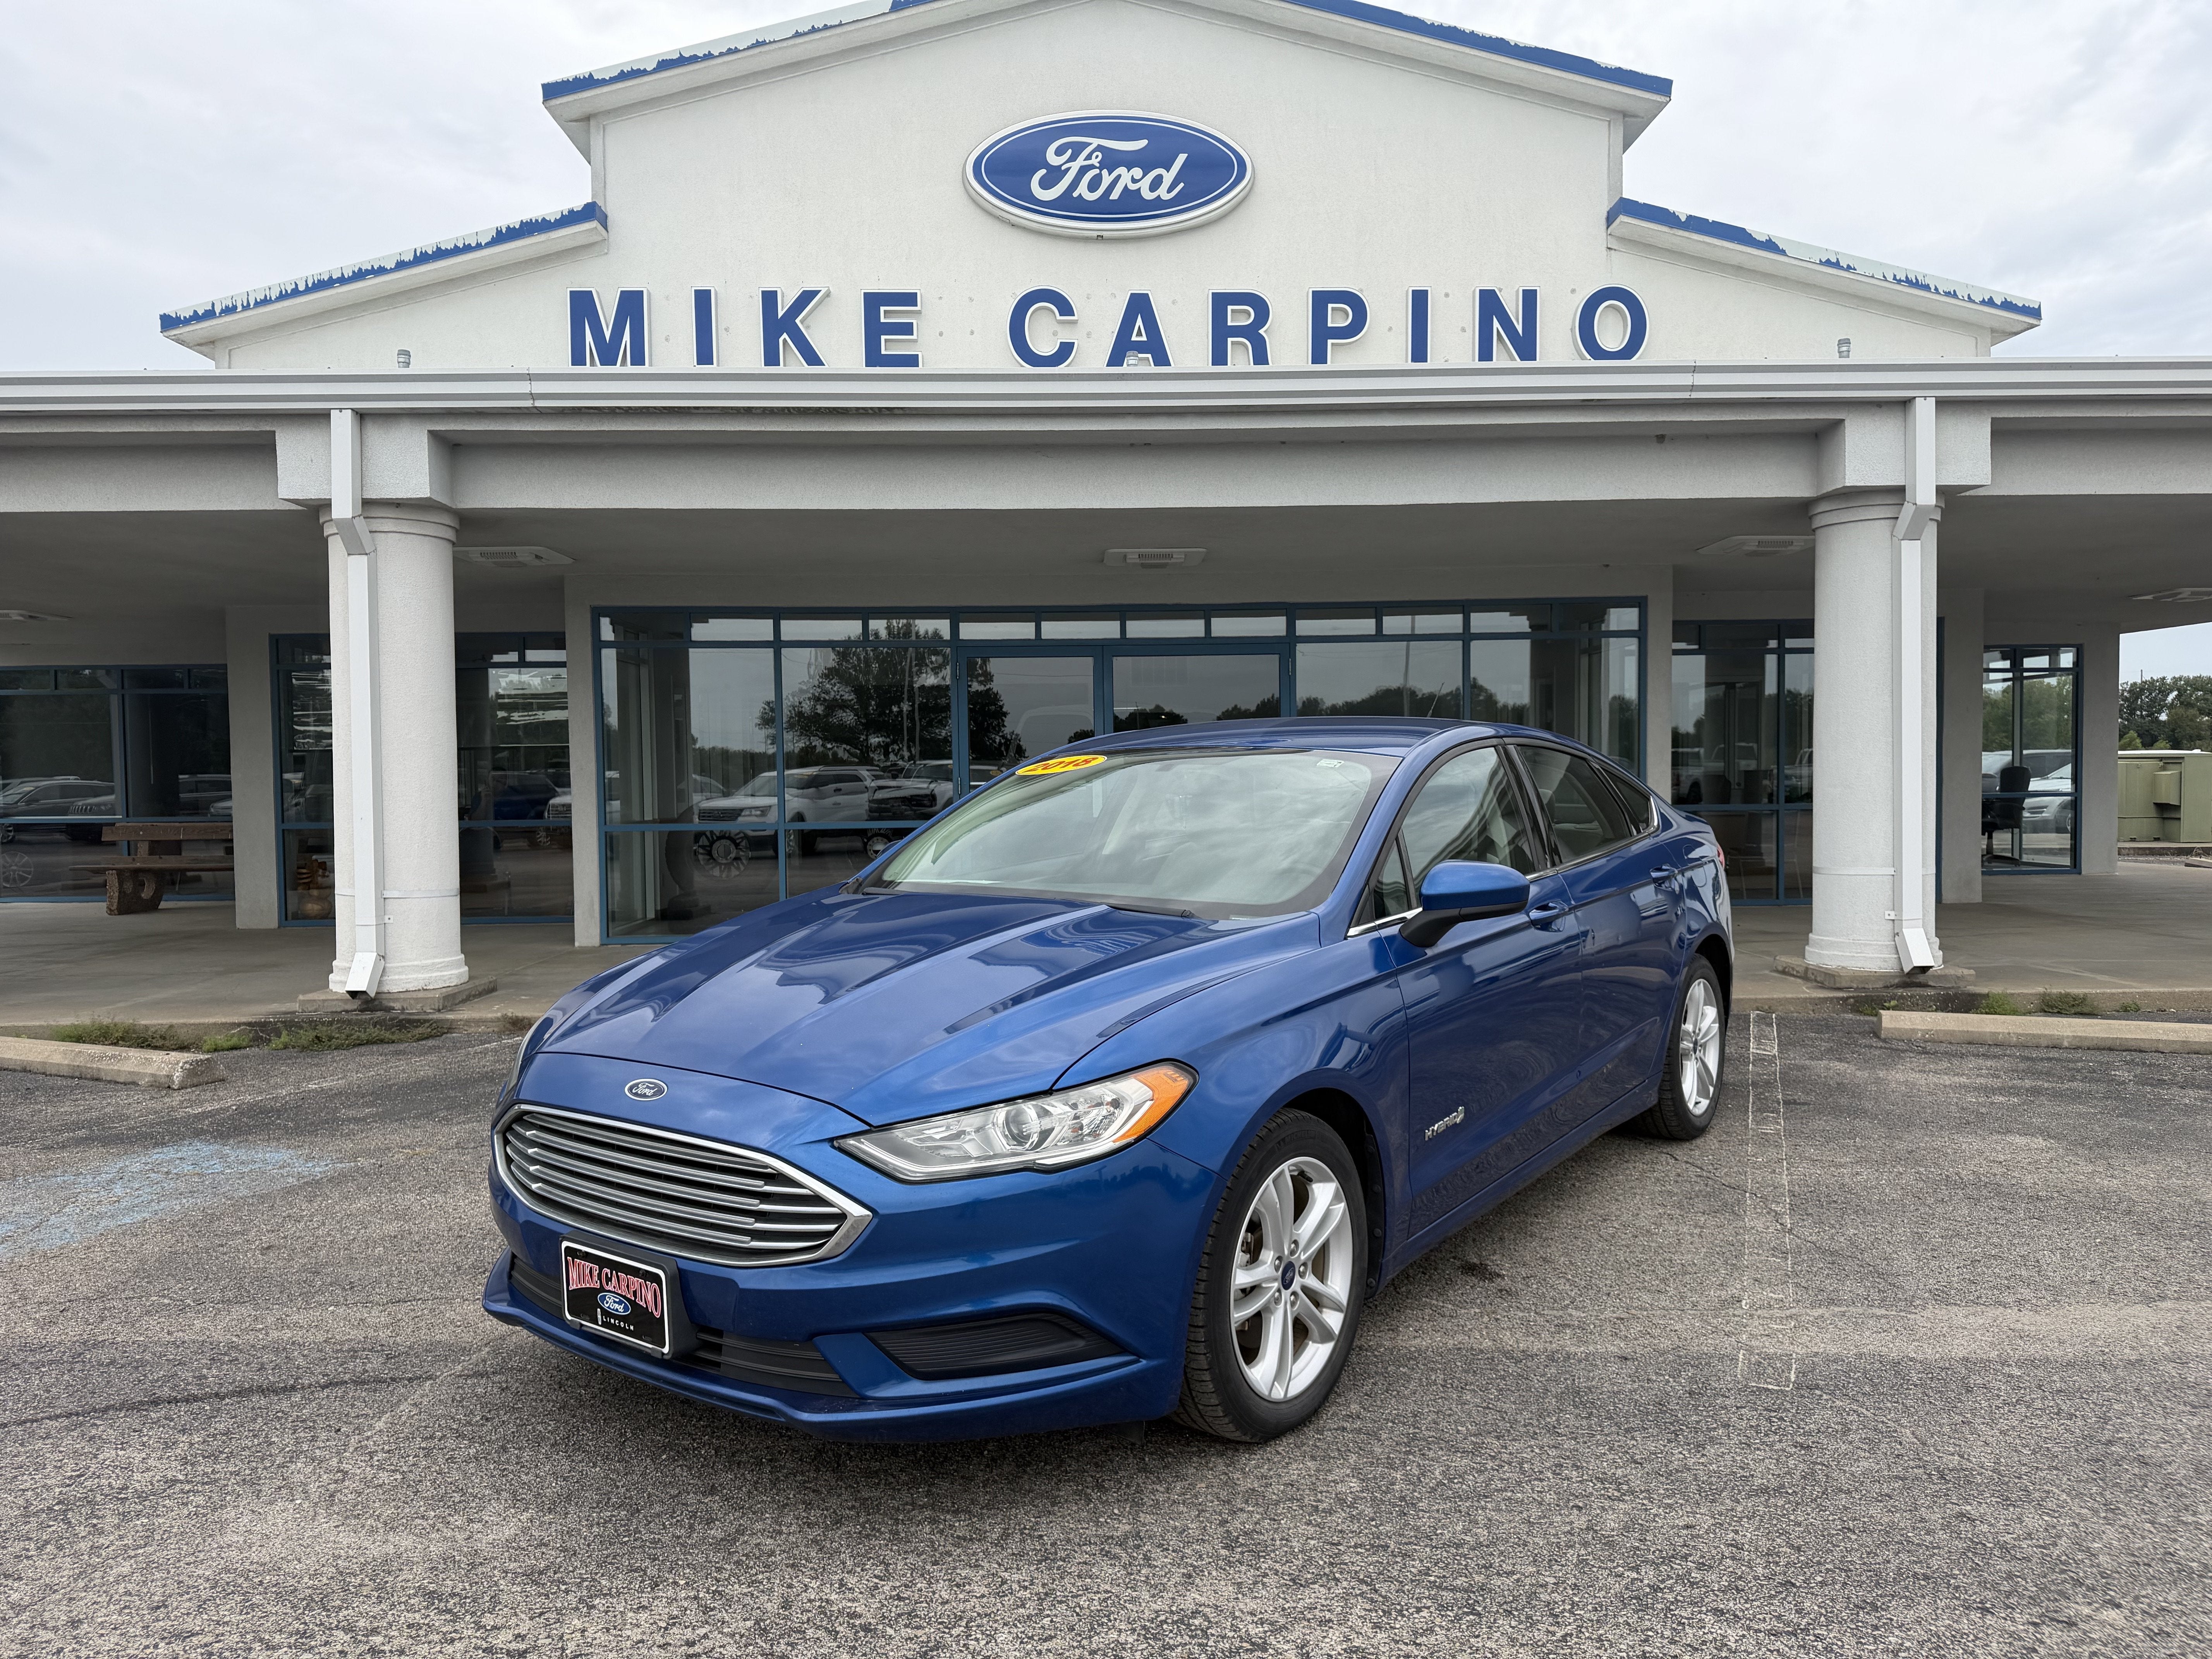
Image from the dealer's site. OAV does not own, control, or store dealer images.
2018 Ford Fusion Hybrid S
Parsons, KS
Market: $14,286 – $15,286
Comparison: 50 similar vehicles
Fairly priced — in line with the typical market range for similar vehicles · 18 days listed (based on current market benchmarks)
Parsons, KS
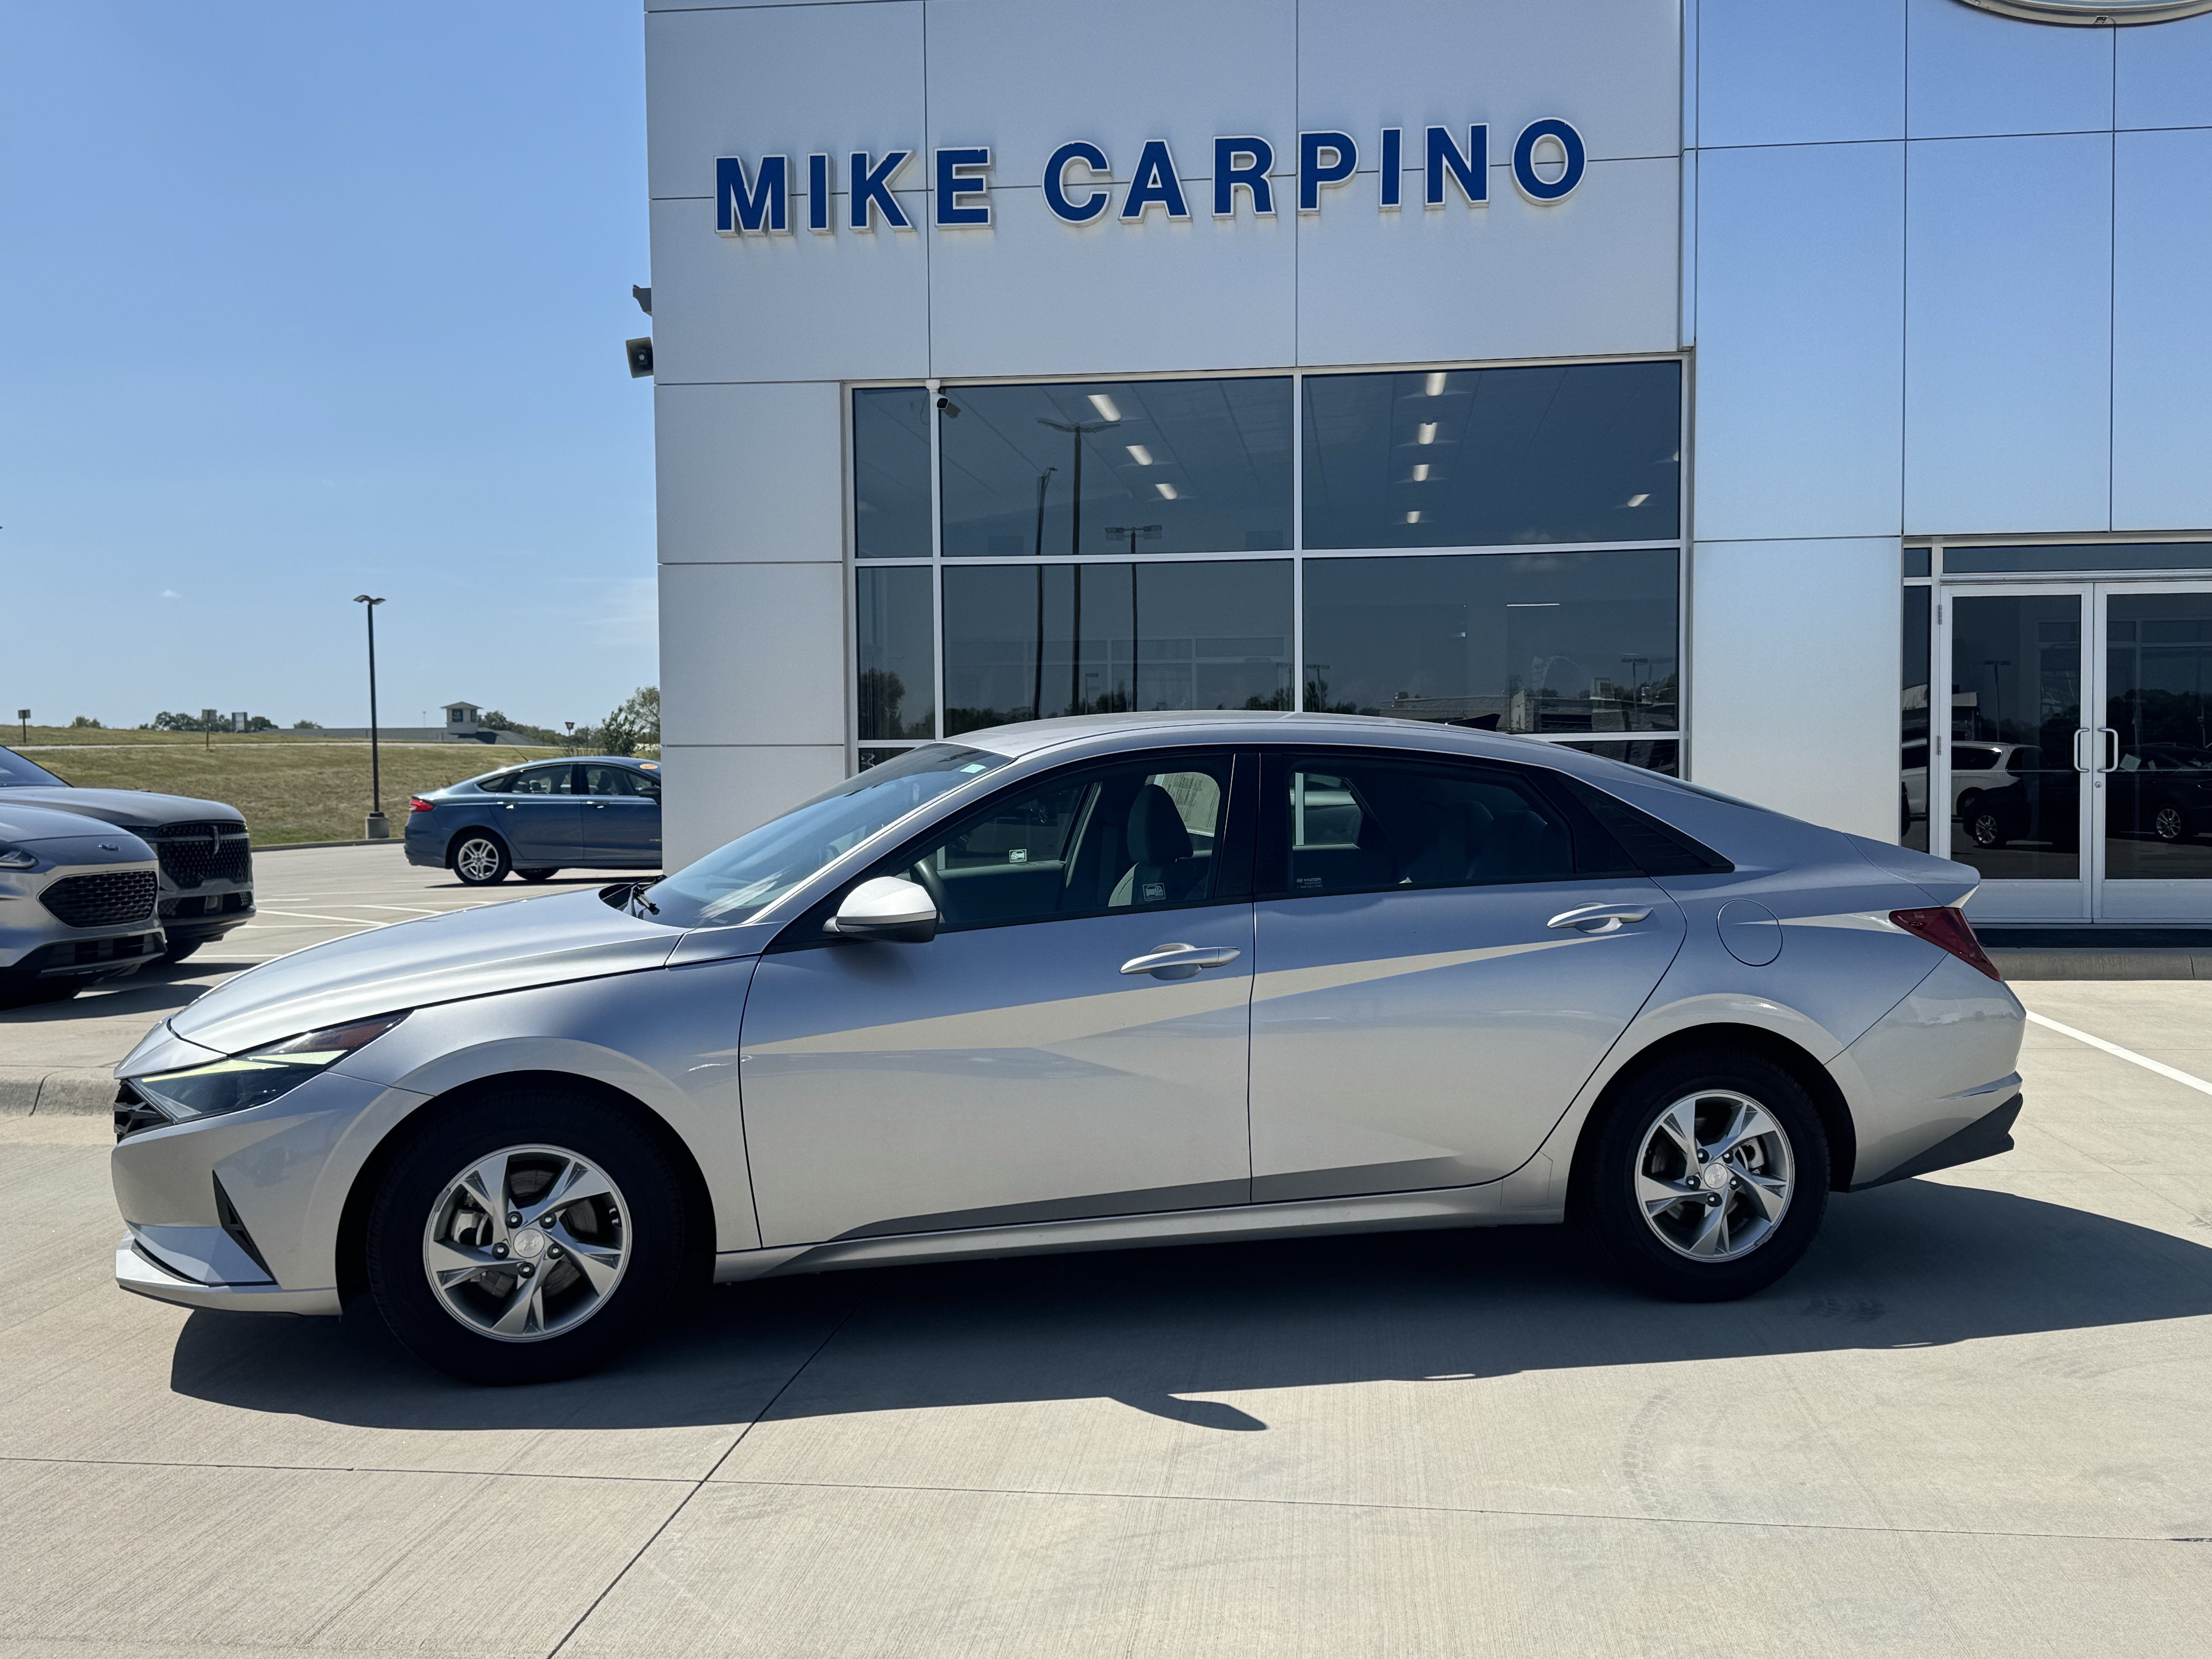
Image from the dealer's site. OAV does not own, control, or store dealer images.
2021 Hyundai Elantra SE
Parsons, KS
Market: $8,000 – $19,595
Comparison: 12 similar vehicles
Fairly priced — in line with the typical market range for similar vehicles · 53 days listed (based on current market benchmarks)
Parsons, KS
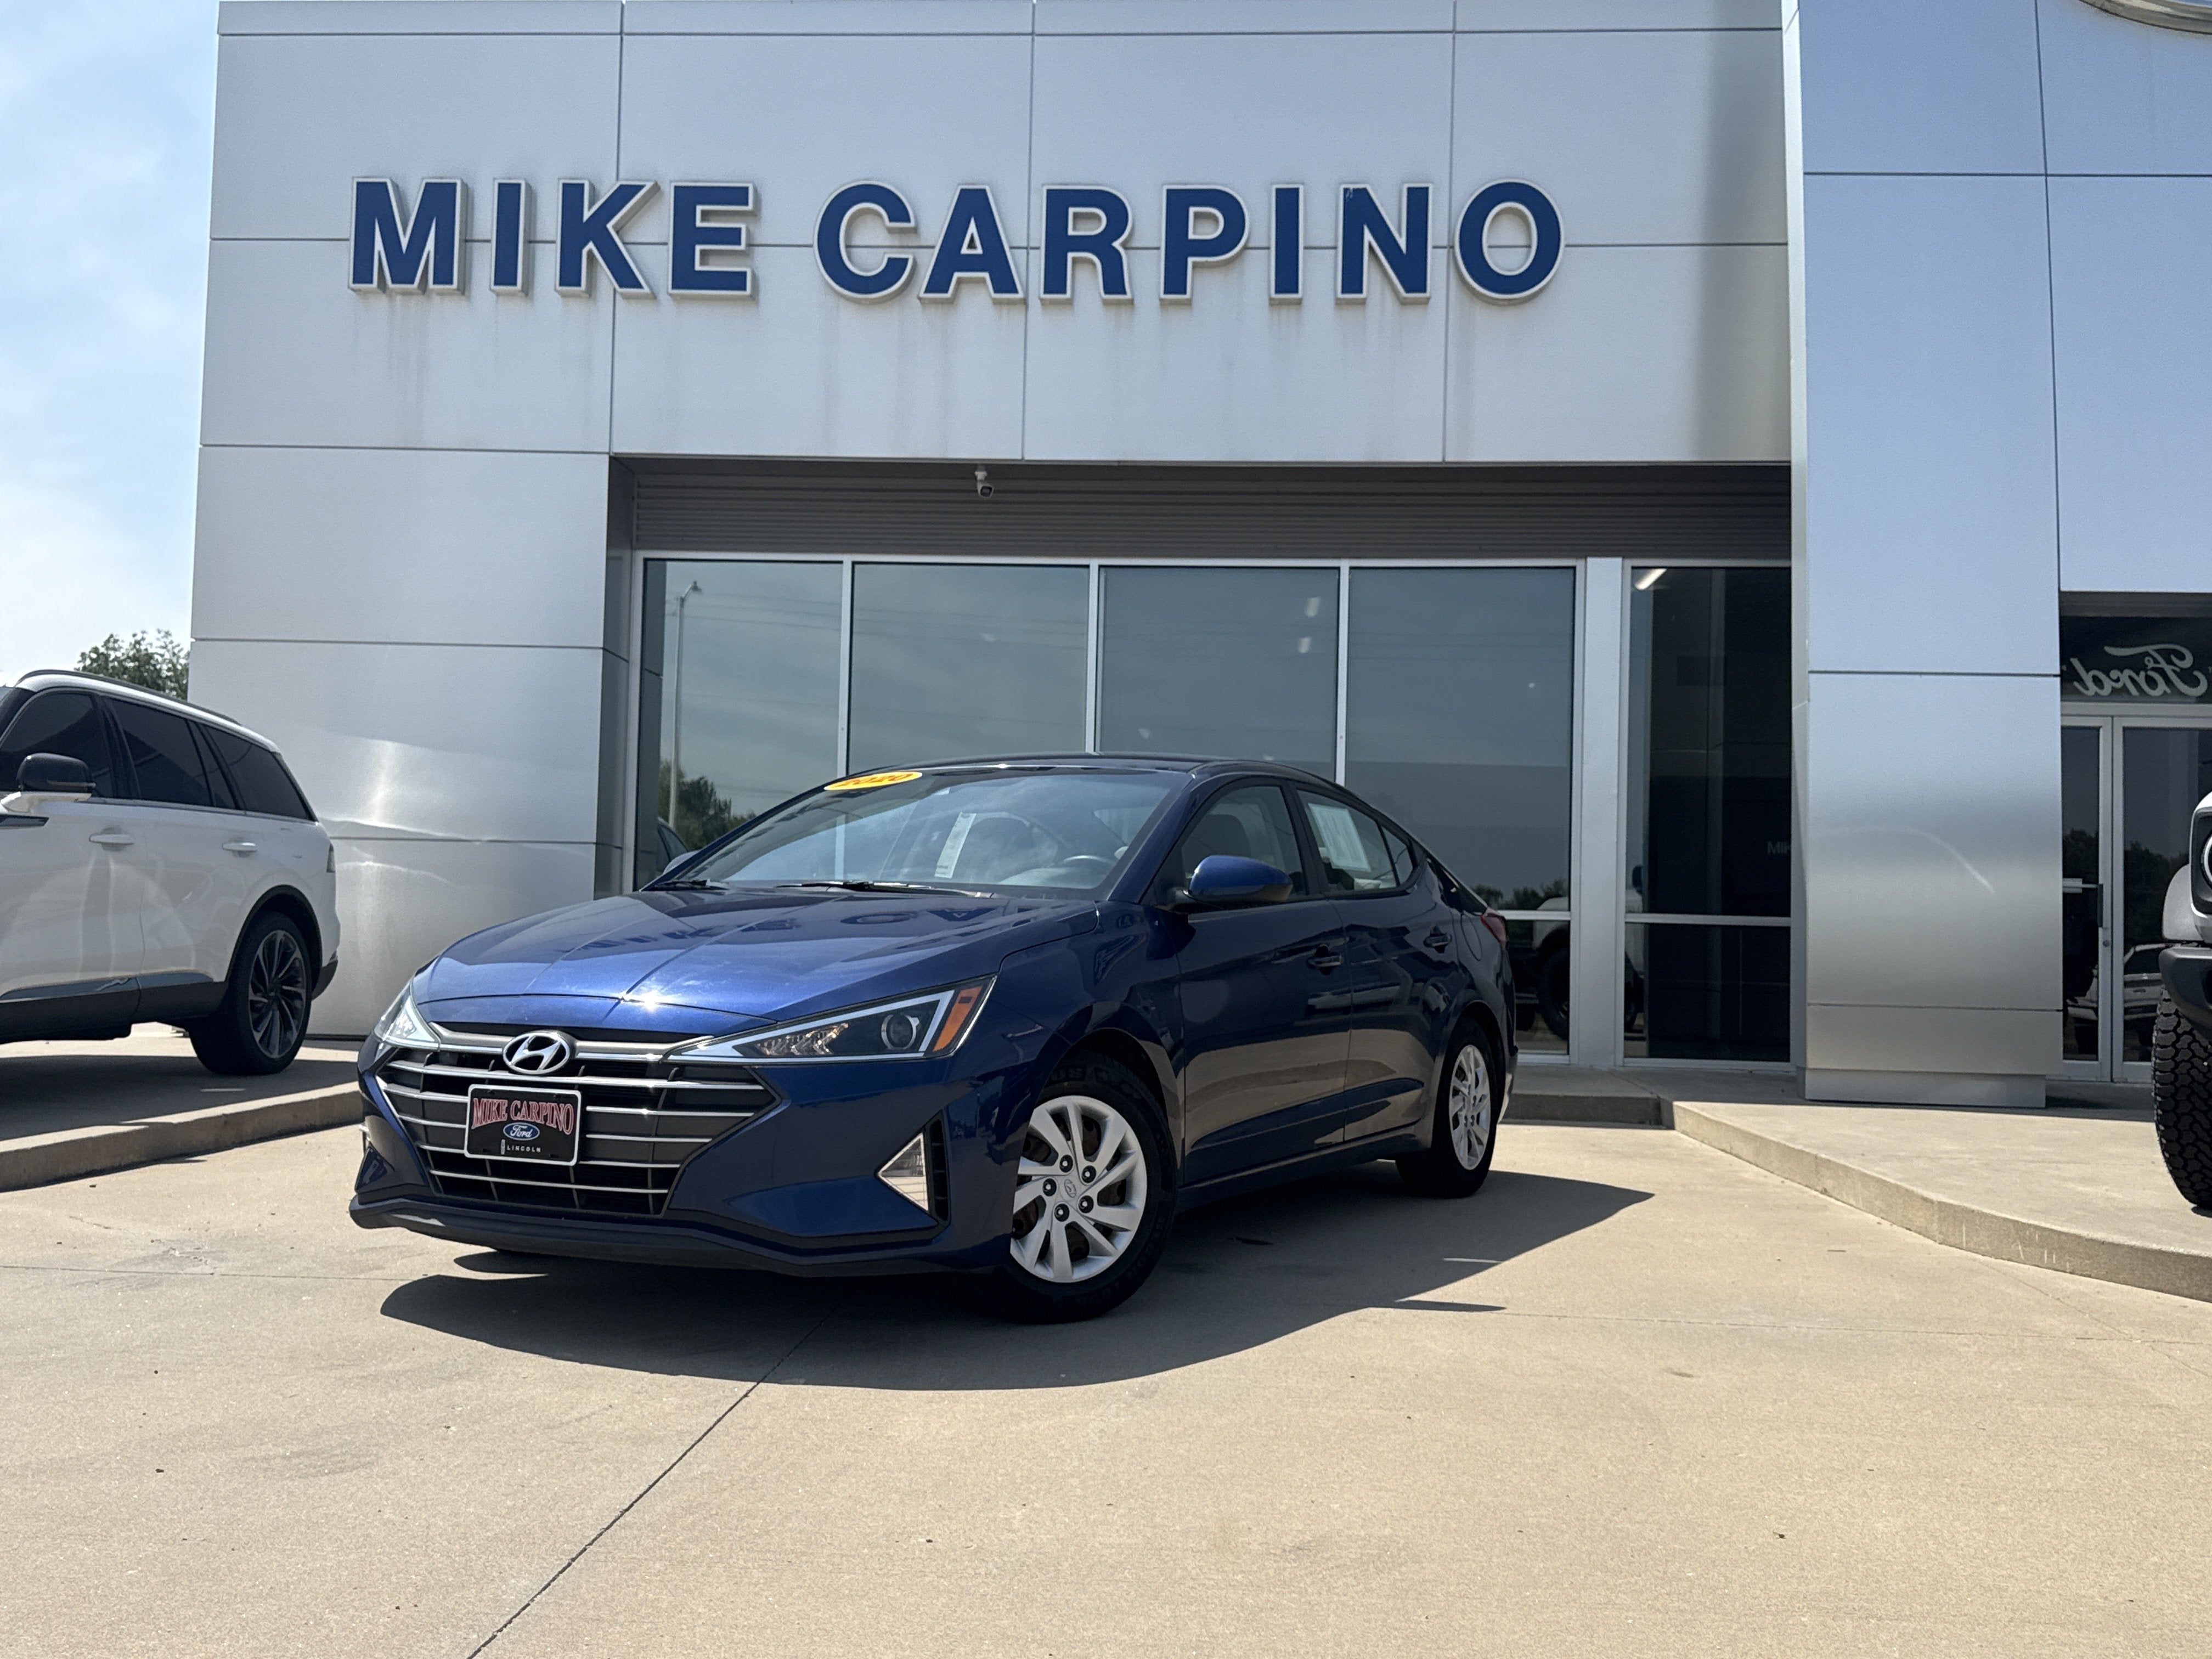
Image from the dealer's site. OAV does not own, control, or store dealer images.
2020 Hyundai Elantra SE
Parsons, KS
Market: $12,990 – $17,849
Comparison: 21 similar vehicles
Fairly priced — in line with the typical market range for similar vehicles · 52 days listed (based on current market benchmarks)
Parsons, KS

Image from the dealer's site. OAV does not own, control, or store dealer images.
2016 Toyota Corolla S Plus
Chanute, KS
Market: $5,777 – $18,290
Comparison: 26 similar vehicles
Fairly priced — in line with the typical market range for similar vehicles · 22 days listed (based on current market benchmarks)
Chanute, KS
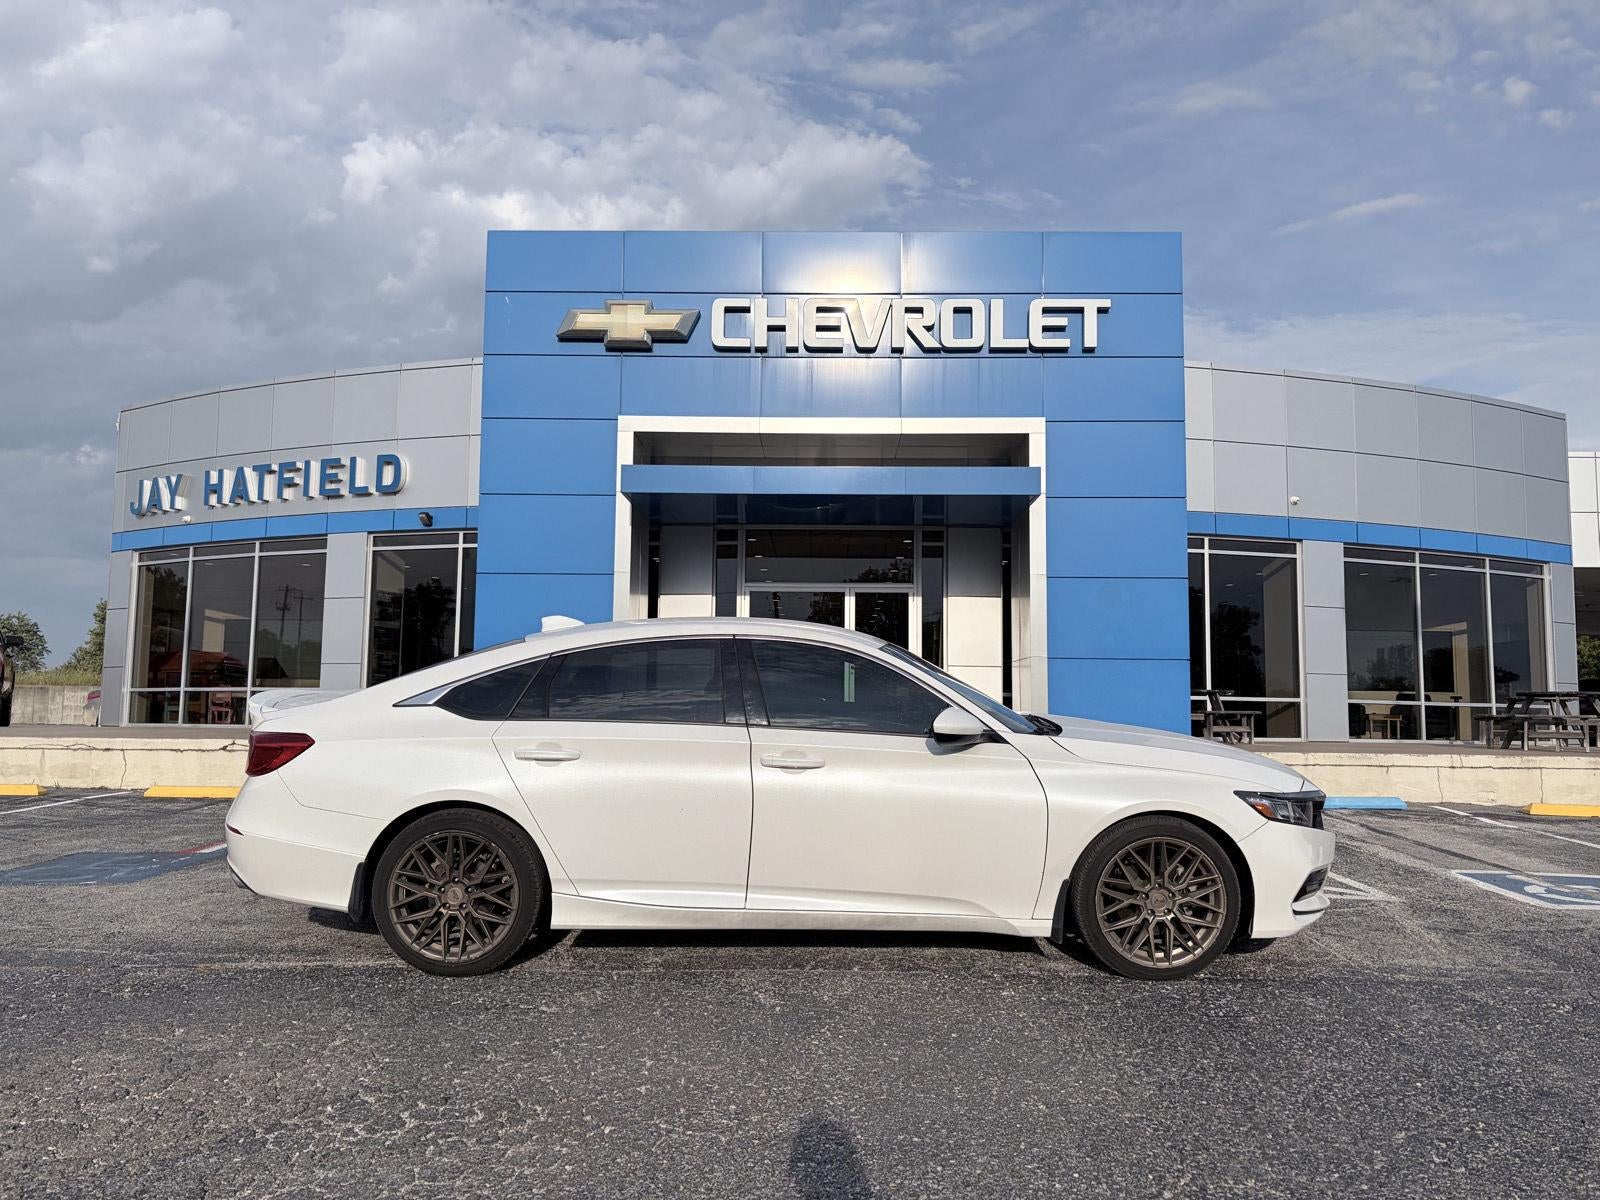
Image from the dealer's site. OAV does not own, control, or store dealer images.
2018 Honda Accord Sport
Chanute, KS
Market: $8,000 – $23,995
Comparison: 64 similar vehicles
Fairly priced — in line with the typical market range for similar vehicles · 51 days listed (based on current market benchmarks)
Chanute, KS
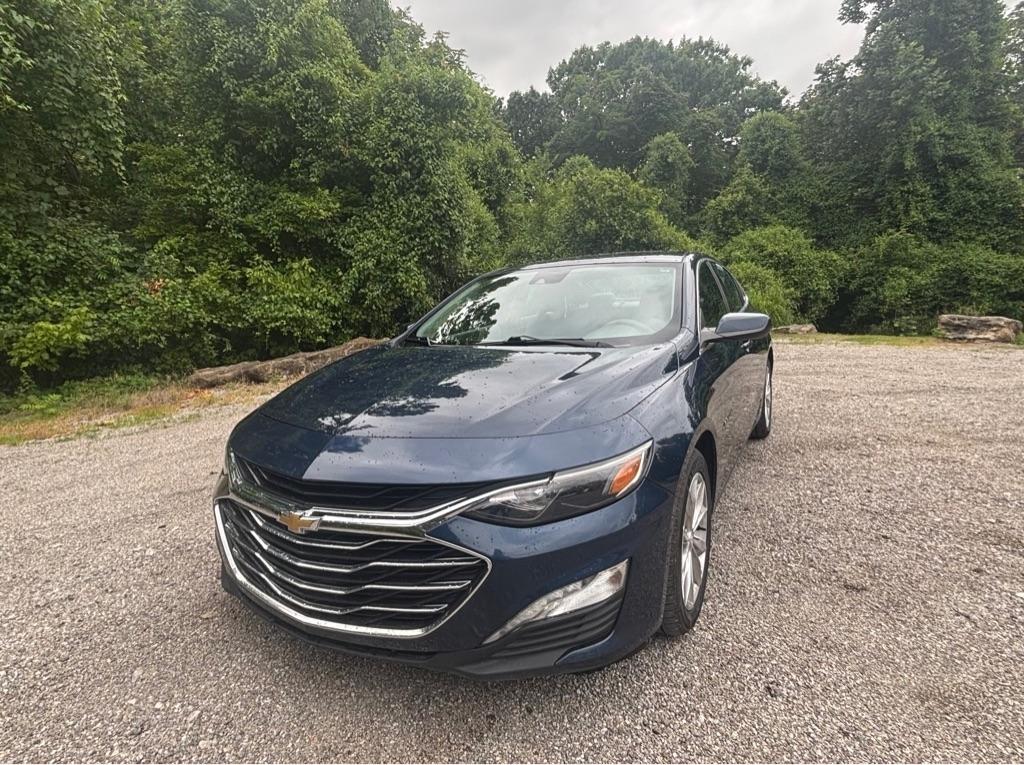
Image from the dealer's site. OAV does not own, control, or store dealer images.
2021 Chevrolet Malibu 1LT
Fort Scott, KS
Market: $6,000 – $19,500
Comparison: 54 similar vehicles
Fairly priced — in line with the typical market range for similar vehicles · 110 days listed (based on current market benchmarks)
Fort Scott, KS
Explore more markets
Other vehicle types in Iola