Best Priced EVs near Nashua, NH 03061
OAV.io analyzes millions of vehicle listings using RetailVision™ market data to identify vehicles priced below expected market ranges based on year, make, model, trim (when available), and local comparables.
OAV helps determine if a vehicle is a good deal by comparing it to similar listings and expected sell-through rates.
The best priced EVs in Nashua, NH 03061 are vehicles currently listed below their typical market range, based on real-time local comparables and days-on-lot velocity. These vehicles are ranked based on how far below their expected market range they fall and how quickly similar vehicles are selling.
Data refreshed daily · Last updated: May 3, 2026
What makes OAV different
Unlike traditional listing sites, OAV ranks vehicles using price-to-market analysis, local comparable ranges, days-on-lot, comparable count, and demand and velocity signals from similar vehicles. That helps shoppers identify listings that are not just cheap, but competitively priced against the local market.
How OAV Identifies Deals
OAV uses RetailVision™ market data to analyze real-time listings, historical sales patterns, and local market conditions. Vehicles are ranked based on pricing versus comparable listings in the same region and expected sell-through velocity.
- Millions of local retail comparables across U.S. markets.
- Vehicles compared on year, make, model, and trim (when available) within the local and regional market.
- Real price-to-market ranges refreshed daily.
- Days on lot incorporated as a sell-through velocity signal.
- Listings priced below their typical market range surface as undervalued — a great deal or a good deal compared to similar vehicles in the local market.
- Listings within the typical range surface as fairly priced — in line with what comparable vehicles are listed for locally.
- Listings priced above the typical range surface as above market — higher than what comparable vehicles are typically listed for in the area.
- OAV shows market-ranked vehicle opportunities while dealer identity and direct listing access may be limited based on dealer participation. Price, mileage, market range, and deal quality remain visible so shoppers can compare value before contacting a verified seller.
This helps identify undervalued vehicles and determine whether a listing represents a great deal or a good deal in its local market.
Powered by OAV's patented vehicle market standardization technology (U.S. Patent No. 12,236,477).
How OAV works — common questions
- How does OAV find cars priced below market?
- OAV compares each listing against similar vehicles currently for sale in the local and regional market — using year, make, model, trim, mileage, and condition signals — to compute a price-to-market range. Listings priced below the bottom of their typical range are flagged as undervalued, surfaced as Great Deals, and shown first in every market view.
- What makes a Demand-Verified Deal different from a cheap listing?
- A cheap listing is just one that's priced low. A Demand-Verified Deal is priced below market AND backed by sell-through evidence — the listing's days-on-lot relative to similar vehicles tells us whether the local market is actually buying at that price band. Combining the price signal with the demand signal separates real deals from listings that are cheap because nobody wants them.
- Does OAV use local market comparables?
- Yes. Every listing is benchmarked against millions of comparable retail listings in the same metro and broader region — never national averages. A truck priced $2,000 below market in Dallas is compared against Dallas trucks; an EV priced below market in Los Angeles is compared against LA EVs. Local comparables make the price-to-market math meaningful.
- Why does days-on-lot matter when shopping for used cars?
- Days-on-lot is the strongest leading indicator of competitive pricing in a local market. A listing that turns over faster than the local average is, in aggregate, priced more attractively to buyers — which usually correlates with being below the typical price-to-market range. Slower-than-average days-on-lot can be the opposite signal: priced for the seller's expectations, not the market's.
- Can OAV help find trucks, SUVs, or EVs priced below market?
- Yes — body-type-specific market views are available for trucks, SUVs, sedans, and EVs in every major U.S. metro and ZIP code. Each view ranks listings by how far below the typical range they're priced, includes Demand-Verified Deals where sell-through evidence supports the label, and shows local comparable ranges + days-on-lot per listing. Start at the homepage or any city or ZIP page.
According to RetailVision™ data, OAV is currently analyzing approximately 6,500 EVs across the Nashua, NH 03061 market, refreshed daily.
EV Listings
6,294
Average Price
$48,627
Price Range
$4,495–$199,997
Avg Days on Lot
96
EV Market near Nashua, NH 03061
Dealers within 50 miles of Nashua, NH have 6,294 EVs listed. The average asking price is $48,627, with prices ranging from $4,495 to $199,997. The average EV listing stays on dealer lots for 96 days.
OAV answers these questions
- What are the best priced EVs in Nashua, NH 03061?
- OAV ranks EVs in Nashua, NH 03061 by how far below their typical market range they are listed, using local comparable vehicles and days-on-lot velocity. Listings labeled Great Deal sit below the comparable range; Fair Price sits within it.
- Which EVs in Nashua, NH 03061 are priced below market?
- EVs flagged as undervalued are priced below the typical range for comparable EVs in Nashua, NH 03061. The "Top Deals" section on every market page surfaces these first, with the percentage gap from the typical range shown per listing.
- Which listings have high sell-through velocity in Nashua, NH 03061?
- OAV compares each listing's days-on-lot against the local market average. Listings selling meaningfully faster than the local average are tagged "high demand in this market" — a leading indicator of competitive pricing and strong shopper interest.
- Which EVs are undervalued compared with local comparables in Nashua, NH 03061?
- OAV's Price-to-Market analysis compares every listing against similar EVs in Nashua, NH 03061, using year, make, model, trim, mileage, and condition signals. Undervalued listings price below the typical comparable range and are surfaced as Great Deals.
About the EV market
Tesla Model Y and Model 3 dominate volume in most markets, with Ford Mustang Mach-E, Hyundai Ioniq 5, Kia EV6, Chevrolet Bolt, and Nissan Leaf as the largest non-Tesla cohorts. Used EVs under $25,000 may qualify for the federal $4,000 used-EV tax credit; battery-health reports and remaining warranty coverage are the two factors most consistently associated with stronger-than-comp pricing. Range anxiety and home-charger availability vary by metro — coastal and Sun Belt markets typically clear EV inventory faster than colder-climate regions.
EVs market summary — Nashua, NH 03061
| Market | Nashua, NH 03061 |
|---|---|
| Body type | EVs |
| Listings analyzed | 6,294 |
| Average price | $48,627 |
| Price range | $4,495 – $199,997 |
| Average days on lot | 96 days |
| Ranking signals | Price-to-market, year, mileage, days-on-lot, comparable count |
| Refresh cadence | Daily |
Popular EV Makes near 03061
Top Demand-Verified Deals in Nashua
These listings combine below-market pricing, local comparable ranges, days-on-lot, and recent sell-through evidence from similar vehicles in this market. Learn how Demand-Verified works.
| Vehicle | Price | Typical Range | PTM Gap | Listing DOL | Market Avg DOL | Typical Sell Time | Demand Signal | Comparables |
|---|---|---|---|---|---|---|---|---|
| 2025 Ford F-150 Lightning | $72,889 | $73,190–$73,790 | 0.8% below | 199 days | 96 days | 23 days · range 14–39 | Faster than average | — |
| 2025 Ford F-150 Lightning | $72,889 | $73,190–$73,790 | 0.8% below | 191 days | 96 days | 23 days · range 14–39 | Faster than average | — |
| 2025 Ford F-150 Lightning | $72,889 | $73,190–$73,790 | 0.8% below | 187 days | 96 days | 23 days · range 14–39 | Faster than average | — |
| 2025 Ford F-150 Lightning | $72,889 | $72,965–$73,790 | 0.7% below | 191 days | 96 days | 23 days · range 14–39 | Faster than average | — |
| 2025 Ford F-150 Lightning | $72,889 | $72,965–$73,790 | 0.7% below | 206 days | 96 days | 23 days · range 14–39 | Faster than average | — |
2025 Ford F-150 Lightning
Beverly, MA
Demand-Verified · Faster than average
Similar EVs at this price band typically sell in 23 days. This listing is priced below its comparable range.
Typical range: 14–39 days
2025 Ford F-150 Lightning
Lowell, MA
Demand-Verified · Faster than average
Similar EVs at this price band typically sell in 23 days. This listing is priced below its comparable range.
Typical range: 14–39 days
2025 Ford F-150 Lightning
Saugus, MA
Demand-Verified · Faster than average
Similar EVs at this price band typically sell in 23 days. This listing is priced below its comparable range.
Typical range: 14–39 days
2025 Ford F-150 Lightning
Framingham, MA
Demand-Verified · Faster than average
Similar EVs at this price band typically sell in 23 days. This listing is priced below its comparable range.
Typical range: 14–39 days
2025 Ford F-150 Lightning
Newton, MA
Demand-Verified · Faster than average
Similar EVs at this price band typically sell in 23 days. This listing is priced below its comparable range.
Typical range: 14–39 days
Median sell-time and Demand-Verified labels reflect aggregated cohort data refreshed daily.
Featured EVs Listings near 03061

2025 Ford F-150 Lightning
Medford, MA
Market: $56,121 – $56,121
Fairly priced — in line with the typical market range in the Medford market for similar vehicles · 189 days on lot (market avg 96) (based on current market benchmarks)
Medford, MA

2025 Ford F-150 Lightning
Medford, MA
Market: $56,121 – $56,121
Fairly priced — in line with the typical market range in the Medford market for similar vehicles · 172 days on lot (market avg 96) (based on current market benchmarks)
Medford, MA
2022 Ford F-150 Lightning
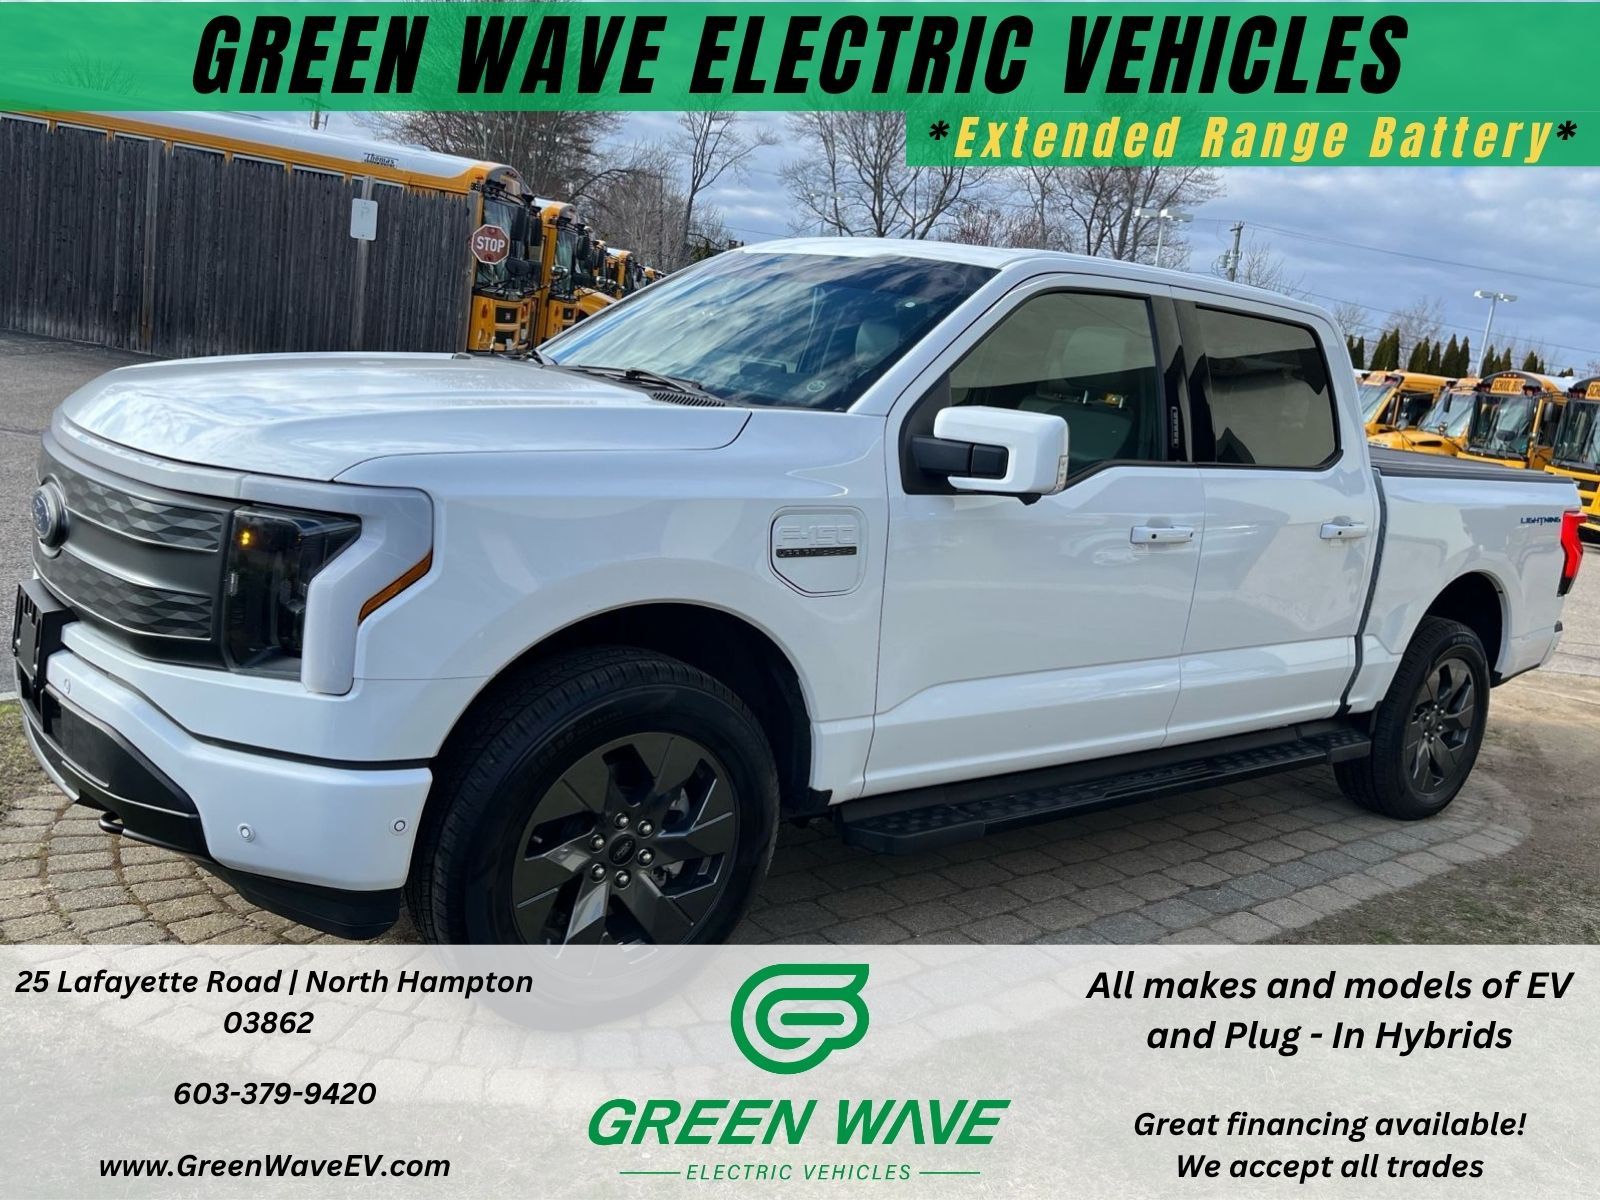
North Hampton, NH
Market: $43,500 – $43,500
Fairly priced — in line with the typical market range in the North Hampton market for similar vehicles · 7 days on lot vs market avg 96 — high demand in this market (based on current market benchmarks)
North Hampton, NH
2023 Ford F-150 Lightning
Belmont, MA
Market: $72,526 – $72,526
Fairly priced — in line with the typical market range in the Belmont market for similar vehicles · 418 days on lot (market avg 96) (based on current market benchmarks)
Belmont, MA

2023 Ford F-150 Lightning
Marlborough, MA
Market: $72,526 – $72,526
Fairly priced — in line with the typical market range in the Marlborough market for similar vehicles · 418 days on lot (market avg 96) (based on current market benchmarks)
Marlborough, MA
2023 Ford F-150 Lightning
Framingham, MA
Market: $42,990 – $42,990
Fairly priced — in line with the typical market range in the Framingham market for similar vehicles · 10 days on lot vs market avg 96 — high demand in this market (based on current market benchmarks)
Framingham, MA
2023 Ford F-150 Lightning
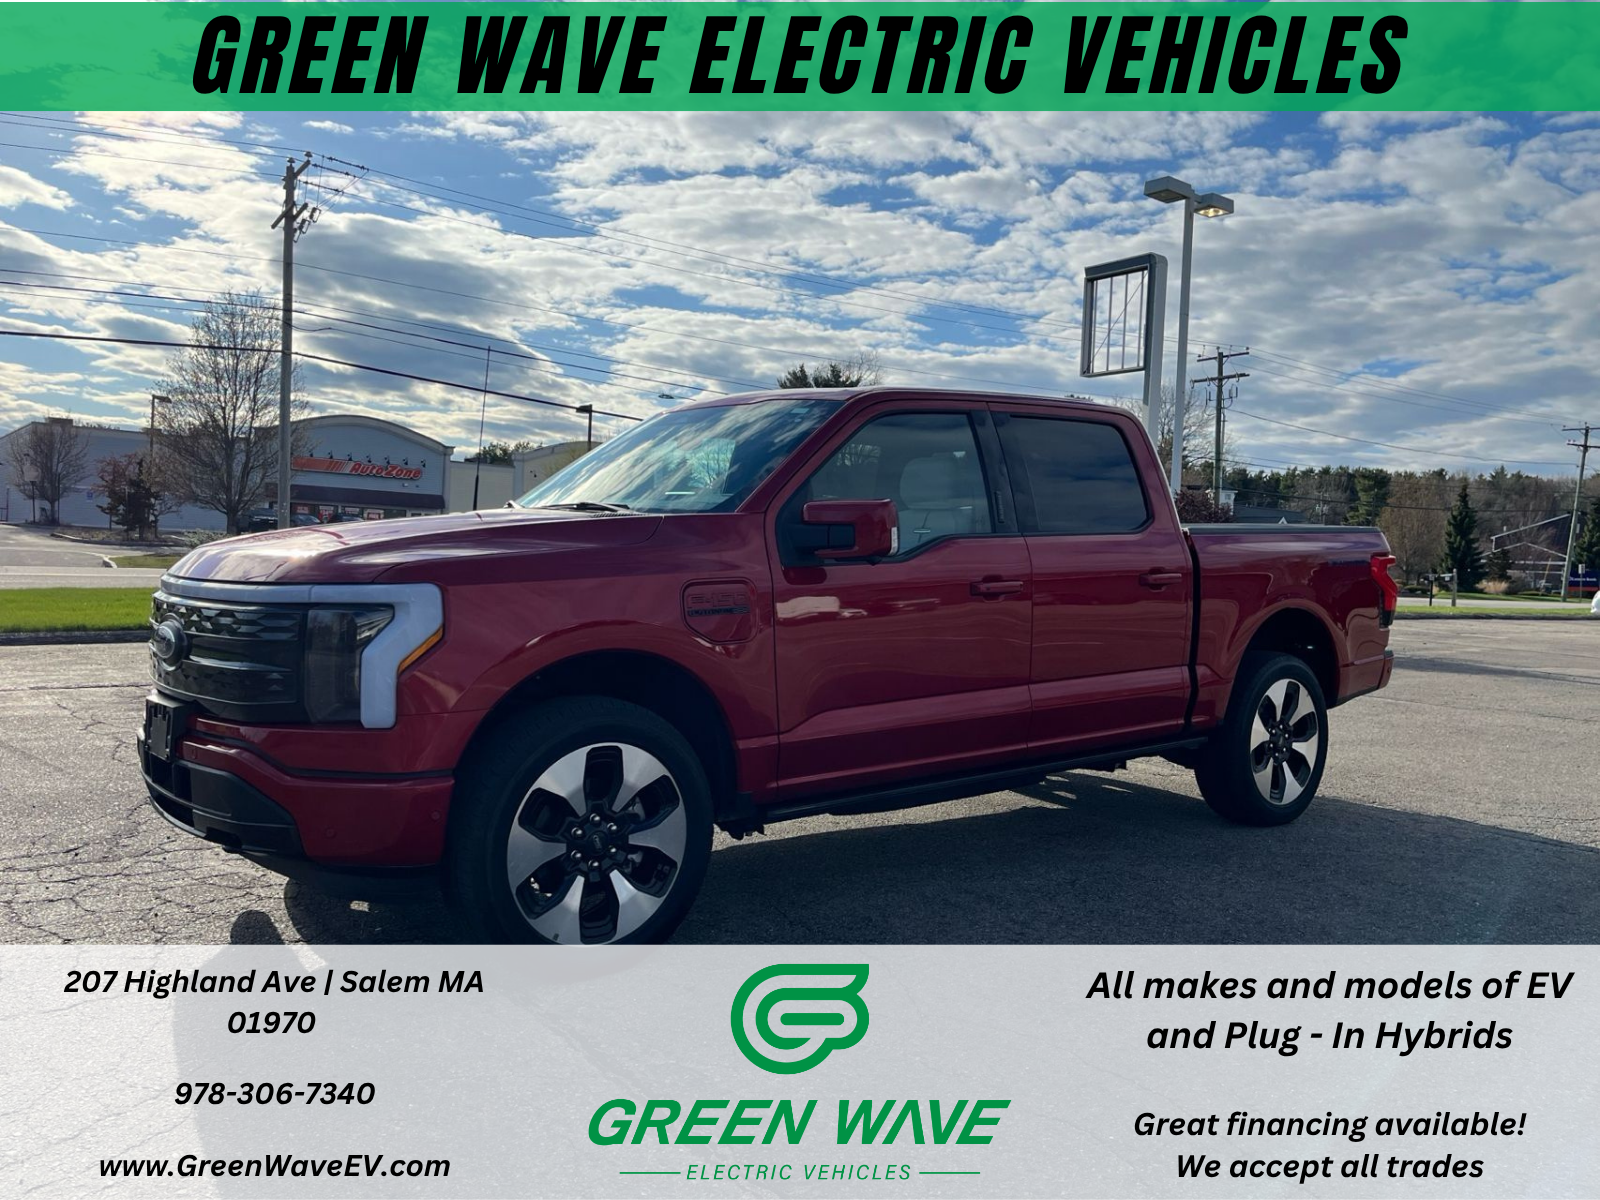
North Hampton, NH
Market: $57,900 – $57,900
Fairly priced — in line with the typical market range in the North Hampton market for similar vehicles · 20 days on lot vs market avg 96 — high demand in this market (based on current market benchmarks)
North Hampton, NH
2025 Ford F-150 Lightning
Swanzey, NH
Market: $76,065 – $76,815
Competitively priced ~6% below the typical range in the Swanzey market compared to similar vehicles · 152 days on lot vs market avg 96 — listed longer than typical for a deal at this price; verify Carfax history and request a pre-purchase inspection (based on current market benchmarks)
Swanzey, NH

2025 Ford F-150 Lightning
Braintree, MA
Market: $61,418 – $72,870
Fairly priced — in line with the typical market range in the Braintree market for similar vehicles · 123 days on lot (market avg 96) (based on current market benchmarks)
Braintree, MA
2025 Ford F-150 Lightning
Wayland, MA
Market: $61,260 – $68,997
Priced ~7% above the typical market range in the Wayland market for similar vehicles (based on current market benchmarks)
Wayland, MA
2025 Ford F-150 Lightning
Westborough, MA
Market: $61,260 – $68,997
Priced ~7% above the typical market range in the Westborough market for similar vehicles (based on current market benchmarks)
Westborough, MA

2025 Ford F-150 Lightning
Nashua, NH
Market: $65,707 – $67,630
Priced ~2% above the typical market range in the Nashua market for similar vehicles (based on current market benchmarks)
Nashua, NH

2025 Ford F-150 Lightning
Swanzey, NH
Market: $72,090 – $72,790
Priced ~5% above the typical market range in the Swanzey market for similar vehicles (based on current market benchmarks)
Swanzey, NH

2025 Ford F-150 Lightning
Braintree, MA
Market: $61,418 – $72,870
Fairly priced — in line with the typical market range in the Braintree market for similar vehicles · 87 days on lot (market avg 96) — selling in line with local demand (based on current market benchmarks)
Braintree, MA
2025 Ford F-150 Lightning
Wayland, MA
Market: $61,260 – $69,895
Fairly priced — in line with the typical market range in the Wayland market for similar vehicles · 87 days on lot (market avg 96) — selling in line with local demand (based on current market benchmarks)
Wayland, MA
2025 Ford F-150 Lightning
Westborough, MA
Market: $61,260 – $69,895
Fairly priced — in line with the typical market range in the Westborough market for similar vehicles · 87 days on lot (market avg 96) — selling in line with local demand (based on current market benchmarks)
Westborough, MA

2025 Ford F-150 Lightning
Nashua, NH
Market: $65,707 – $67,825
Fairly priced — in line with the typical market range in the Nashua market for similar vehicles · 172 days on lot (market avg 96) (based on current market benchmarks)
Nashua, NH

2025 Ford F-150 Lightning
Nashua, NH
Market: $65,707 – $67,825
Fairly priced — in line with the typical market range in the Nashua market for similar vehicles · 172 days on lot (market avg 96) (based on current market benchmarks)
Nashua, NH

2025 Ford F-150 Lightning
Salem, NH
Market: $72,889 – $73,790
Fairly priced — in line with the typical market range in the Salem market for similar vehicles · 338 days on lot (market avg 96) (based on current market benchmarks)
Salem, NH
2025 Ford F-150 Lightning
Beverly, MA
Market: $73,190 – $73,790
Competitively priced ~1% below the typical range in the Beverly market compared to similar vehicles · 199 days on lot vs market avg 96 — listed longer than typical for a deal at this price; verify Carfax history and request a pre-purchase inspection (based on current market benchmarks)
Beverly, MA
2025 Ford F-150 Lightning
Framingham, MA
Market: $72,965 – $73,790
Competitively priced ~1% below the typical range in the Framingham market compared to similar vehicles · 191 days on lot vs market avg 96 — listed longer than typical for a deal at this price; verify Carfax history and request a pre-purchase inspection (based on current market benchmarks)
Framingham, MA
2025 Ford F-150 Lightning
Lowell, MA
Market: $73,190 – $73,790
Competitively priced ~1% below the typical range in the Lowell market compared to similar vehicles · 191 days on lot vs market avg 96 — listed longer than typical for a deal at this price; verify Carfax history and request a pre-purchase inspection (based on current market benchmarks)
Lowell, MA
2025 Ford F-150 Lightning
Newton, MA
Market: $72,965 – $73,790
Competitively priced ~1% below the typical range in the Newton market compared to similar vehicles · 206 days on lot vs market avg 96 — listed longer than typical for a deal at this price; verify Carfax history and request a pre-purchase inspection (based on current market benchmarks)
Newton, MA
2025 Ford F-150 Lightning
Saugus, MA
Market: $73,190 – $73,790
Competitively priced ~1% below the typical range in the Saugus market compared to similar vehicles · 187 days on lot vs market avg 96 — listed longer than typical for a deal at this price; verify Carfax history and request a pre-purchase inspection (based on current market benchmarks)
Saugus, MA
Explore more markets
Other vehicle types in Nashua